
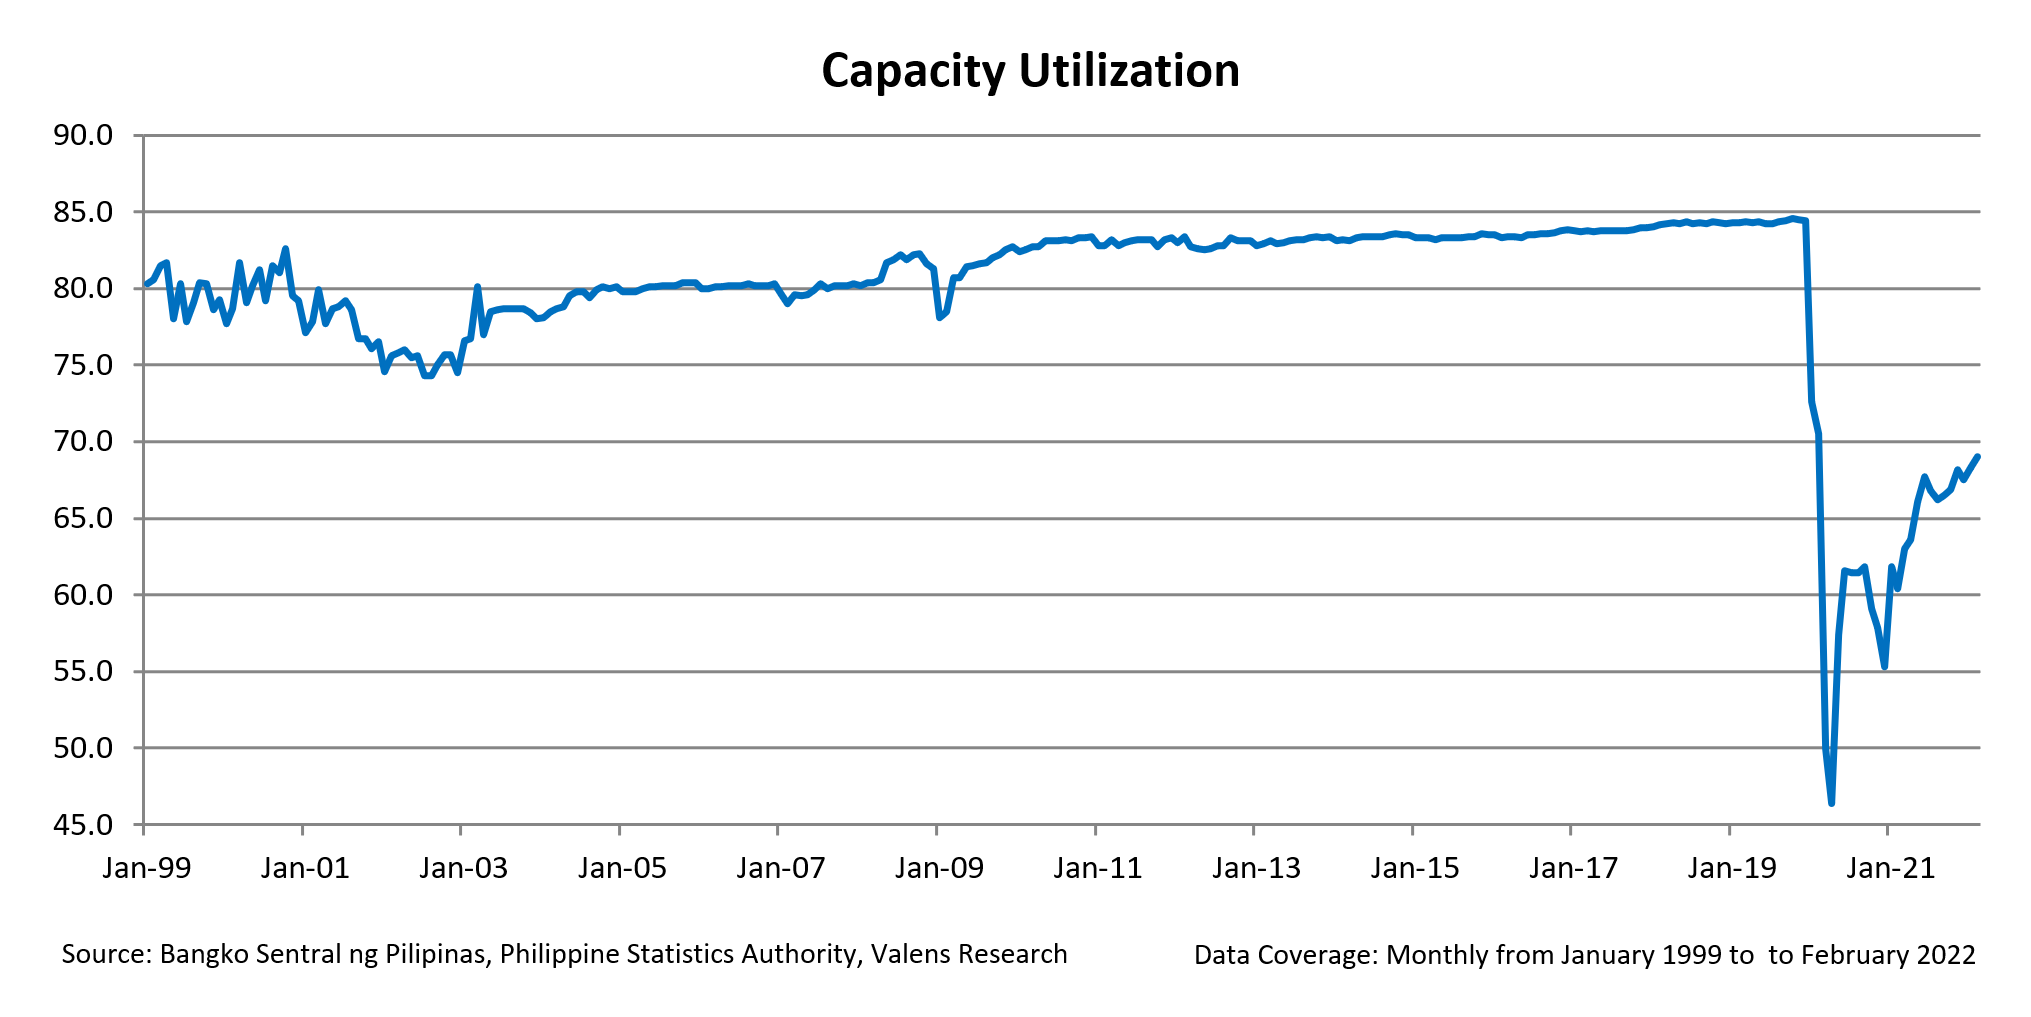
MONDAY MACRO: The capacity utilization rate of the manufacturing industry recorded a 9% annual increase in February 2022

In March 2020, the capacity utilization rate dropped to 49.9% from 70.5% in the month prior. Since then it has been steadily recovering. Is the annual increase in capacity utilization for February 2022 a signal of recovery for the industry?
Philippine Markets Newsletter:
The Monday Macro Report
Powered by Valens Research
With most cities in the Philippines now under the least restrictive Alert Level 1 status, business establishments are seeing a steady increase in foot traffic. Some malls have even recorded higher foot traffic than pre-pandemic levels.
As people become more comfortable about leaving their homes, more offices have started requiring their employees to return to on-site work. More factories have also started to increase production since mid-2021.
The manufacturing industry is on its way to recovering from the effects of the COVID-19 pandemic.
The value of production index (VaPI) and volume of production index (VoPI) recorded a consistent annual increase in January and February 2022. These metrics indicate the changes in the monthly production values and volume of manufacturing, relative to the values in 2018.
In January 2022, the VaPI grew at an annual rate of 21.8%, while the VoPI increased by 17.1%. This further improved in February 2022 when VaPI and VoPI recorded an annual growth of 92.4% and 84.3%.
These are results of the positive growth rates from the various industry divisions. In particular, the manufacture of petroleum coke and refined petroleum products emerged as the major contributor to the growth in the production index for total manufacturing.
Consistently, the value of the net sales index (VaNSI) and volume of net sales index (VoNSI) further improved through the contribution of the aforementioned industry division.
Now that we’re seeing continuous growth in the production and sales index, let’s take a look at how this impacted capacity utilization in the Philippines.
As you’ll recall, capacity utilization essentially measures slack in the economy. In other words, it compares a country’s current production relative to how much it can potentially produce without causing inflationary pressures. Historically, it is a lagging indicator of recession, and large dips signal subdued capex and therefore low inflation moving forward.
Companies operating at 85% capacity utilization are normally considered as operating at an optimal rate.
Since its lows in March 2020, capacity utilization has increased to 69%, which is still far from recovering to pre-pandemic levels of nearly 85%. This means as of February 2022, companies still have a lot of room to increase production before they will need to invest in capex.
Unlike the production and sales index, the capacity utilization rate was led by the manufacture of furniture, manufacture of other non-metallic mineral products, and manufacture of tobacco products.
The increased manufacturing of these goods reveals growing discretionary income as consumer consumers can add little luxuries to their spending habits. Cigarette purchases also benefited from the tailwind of decreasing COVID-19 cases.
Moving forward, we can expect the continued rise in capacity utilization as businesses return to pre-pandemic operations. However, we can expect this increase to be slow and steady, particularly because of the global supply chain overhang that continues to put pressure on the availability of certain goods.
About the Philippine Markets Newsletter
“The Monday Macro Report”
When just about anyone can post just about anything online, it gets increasingly difficult for an individual investor to sift through the plethora of information available.
Investors need a tool that will help them cut through any biased or misleading information and dive straight into reliable and useful data.
Every Monday, we publish an interesting chart on the Philippine economy and stock market. We highlight data that investors would normally look at, but through the lens of Uniform Accounting, a powerful tool that gets investors closer to understanding the economic reality of firms.
Understanding what kind of market we are in, what leading indicators we should be looking at, and what market expectations are, will make investing a less monumental task than finding a needle in a haystack.
Hope you’ve found this week’s macro chart interesting and insightful.
Stay tuned for next week’s Monday Macro report!
Regards,
Angelica Lim
Research Director
Philippine Markets Newsletter
Powered by Valens Research
www.valens-research.com


