
MONDAY MACRO: Though it has been dark skies and rain showers recently, this indicator forecasts partly cloudy skies while bond yields remain low

In the past weeks, the Philippines has been experiencing warm days followed by heavy rain showers, only to return to hotter days. This weather pattern might have appeared unpredictable over a century ago, but thanks to modern technology, we know what to expect most of the time.
Forecasting isn’t just limited to the weather. It can even manifest itself in certain economic indicators, such as what bondholders think about the economy. We take a look at how this particular indicator helps analysts, economists, and investors better understand how sentiment impacts both current and future investments.
Philippine Markets Daily:
The Monday Macro Report
Powered by Valens Research
In the 19th century, Admiral Robert FitzRoy made the first weather forecast.
In the Victorian era, wind charts and animal behavior were widely used as indicators of the weather, specifically to detect incoming storms.
However, with no warning days or even hours before, many sailors at sea perished in the rough waters. This deeply troubled Admiral FitzRoy, who then made it his mission to figure out a way to inform sailors of potential storms beforehand. He used the telegraph network to collect real-time weather data and warn outposts of approaching gales. As he did this, he realized he could also publish weather forecasts, conclusions of atmospheric data analyses.
Admiral FitzRoy was mostly successful in warning people about incoming storms. However, the weather isn’t something that could be accurately predicted, and FitzRoy could not stress this enough. He was making forecasts, not predictions or prophecies.
That’s also what we mention a lot here at Valens. Indicators are used not to predict what will happen—they’re used as tools to tell us what could happen. Whether they are for typhoon floodings or for economic growth, indicators help us mitigate avoidable damages or capitalize on growth opportunities.
We’ve mentioned some of these indicators in our October 5th Monday Macro report where we talk about how consumer confidence is an indicator of inflation based on historical data. With consumer sentiment plunging to negative levels in Q3 2020 due to quarantine measures, consumer demand and spending are expected to decline. With weak demand and spending, inflationary pressures are also likely to remain weak.
Meanwhile, treasury bond yields are another indicator used to measure upcoming economic cycles. As a recap, bond yields are the return on investment from government debt obligations. Ranging from 3-month to 10-year yields, these yields need to be monitored because they reflect bondholder sentiments for the economy.
Because treasury bond yields are issued by the government, they are considered to have a low risk of default. When a government starts running on a deficit, it can either print more money or increase revenue collections through taxes. In most cases, governments do not default. This near certainty for investors in getting their capital back allows treasury bond yields to be as low as possible and still remain attractive.
To the economy, treasury bond yields and the difference between short-term and long-term bonds are essential to bondholder sentiment.
Because of the shorter duration, short-term bonds offer lower yields. Meanwhile, long-term bonds offer higher yields because investors need higher interest rates to hold on to an investment for a longer period of time. As such, optimism for the economy is generally shown when long-term treasury bond yields rise.
However, if long-term yields start falling, that could be a signal for concerns of slowing economic growth.
Low-risk government debt obligations will be highly demanded in this scenario, so treasury bonds would have to be offered at higher prices to answer the demand. The higher prices mean lower treasury bond yields, or return on investment, because investors would be receiving just a fixed face value, which is normally at par, and interest rate. Furthermore, once long-term yields fall below short-term yields, we have an inverted yield curve, a signal that a recession is near.
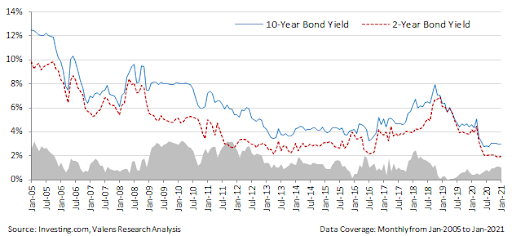
Similar to the chart in our previous report on bond yields, 10-year bond yields briefly fell to a level lower than 2-year bond yields in March 2019. The continued declines in treasury bond yields were partly a response to the growing concerns of a potential recession from the brief inversion of the yield curve in the US at that time, as well as the anticipation of declining global oil prices.
Fortunately, the yield spread between 10-year and 2-year bond yields have slightly improved because of the rate cuts of the Bangko Sentral ng Pilipinas (BSP). By cutting policy rates by 25 basis points, the BSP established a more attractive environment for private or corporate debt issuance.
Throughout 2020, bond yields continued to decline, indicating pessimistic expectations from bondholders. However, bond yields rebounded slightly in September as a result of improved inflation and lower unemployment rates in Q3 2020.
Then, in January 2021, 10-year bond yields declined to 2.9% from last month by 0.9% while 2-year bond yields improved to 1.9% from last month by 2.7%. Additionally, the yield spreads between 10-year and 2-year bond yields have improved from 0.4% in January 2020 to 1.0% in January 2021.
The mixed bond yields in January 2021 were motivated by the BSP dismissing any expansionary actions in H1 2020 because of expectations of an economic rebound.
Although bondholders might remain pessimistic as analysts forecast bond yields to remain low throughout the year, vaccine rollouts are expected to alleviate investor concerns. We might see bond yields move higher once more, particularly by the end of the year as the economy continues to recover.
Furthermore, the Philippines’ credit fundamentals are still healthy as the top firms have sizable liquidity for the next five years. This remains an important aspect in the recovery of the Philippine economy as it is highly unlikely for a credit crunch for top corporations, emphasizing the attractiveness of the private bond markets locally.
With private and treasury bond markets competing for investments in the near future, this signals for treasury bond yields as well as the Philippine economy to potentially rebound rapidly once the pandemic ends.
About the Philippine Market Daily
“The Monday Macro Report”
When just about anyone can post just about anything online, it gets increasingly difficult for an individual investor to sift through the plethora of information available.
Investors need a tool that will help them cut through any biased or misleading information and dive straight into reliable and useful data.
Every Monday, we publish an interesting chart on the Philippine economy and stock market. We highlight data that investors would normally look at, but through the lens of Uniform Accounting, a powerful tool that gets investors closer to understanding the economic reality of firms.
Understanding what kind of market we are in, what leading indicators we should be looking at, and what market expectations are, will make investing a less monumental task than finding a needle in a haystack.
Hope you’ve found this week’s macro chart interesting and insightful.
Stay tuned for next week’s Monday Macro report!
Regards,
Angelica Lim
Research Director
Philippine Markets Daily
Powered by Valens Research
www.valens-research.com