
PH Monday Macro: Another inflation barometer is telling the same story

Numerous barometers are utilized to track inflation, with some notable ones including the Consumer Price Index (“CPI”), Core Inflation, and Personal Consumption Price Index. Each of these measures focuses on a distinct basket of goods and services.
The plethora of inflation measurement methods can be confusing for investors.
However, one overlooked index provides an insightful perspective on inflation, as it is specifically tailored to assess critical components of the Philippine economy.
Philippine Markets Daily:
The Monday Macro Report
Powered by Valens Research
CPI, commonly known as “Headline Inflation,” measures the overall change in consumer prices based on a basket of goods and services while Core Inflation is CPI excluding volatile components such as Food and Oil.
These measurements focus on the common prices that consumers pay. Both are suitable gauges for inflation.
However, if we want to be specific and want to obtain some understanding of a particular economic force, we use a different index or quantification with a specific weighting.
One of them is the General Retail Price Index (“GRPI”). The GRPI primarily focuses on tracking commodity products, including food, fuel, manufactured goods, machinery, and other small items like clothing and furniture.
Unlike CPI, where the index derives its figure by a weighted average of the change in the price of goods and services, the GRPI has its own weighting that focuses on commodities significant to the Philippine economy.
In the latest release by the Philippine Statistics Authority, the top three weighted commodity groups in the GRPI are as follows: Food (37.5%), Machinery & Transport Equipment (24.1%), and Manufactured Goods (16.0%).
Food holds a significant weight in this index due to its role as a non-discretionary and relatively non-elastic essential for consumers. Within this category, there are specific sub-components highly sought after in the Filipino cuisine, including fish, vegetables, and canned foods.
Consequently, any upward or downward movement in this component is of paramount importance because it can have a direct impact on consumer spending patterns.
The next heavily weighted category is Machinery and Transport Equipment. In 2021, integrated circuits, office machine parts, and semiconductor combined contributed to more than 30% in Philippine export value.
As such, the GRPI offers insights into not only the consumers and business of the Philippines but also global trends. A reason for this is because these products rely on materials imported from international markets during their production processes and the Philippines exports them to different regional markets.
Lastly, manufactured goods are heavily weighted because of their relationship to construction. We’ve briefly mentioned the significance of the construction industry to the Philippine economy in our previous report–it employs thousands of workers and is a driver of long-run economic growth.
Now, let us see what the GRPI is telling us…
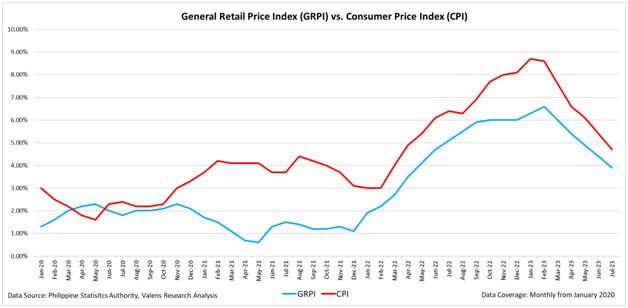
As observed, there is a noticeable correlation between headline inflation and the GRPI. However, neither can be strictly classified as leading or lagging indicators for each other, as there are periods of inverse correlation and others where they move congruently.
Examining the chart, it becomes evident that inflation reached its peak earlier this year and has since reversed its trajectory, shifting into a downward trend. This signifies a moderation in price increases, bringing them near to pre-pandemic levels and aligning closely with the central bank’s target range of 2%-4% for headline inflation.
Nevertheless, it’s crucial to note that the GRPI does not encompass a comprehensive measure of overall inflation. Instead, it focuses on specific components that hold significance over the economic health and growth of the Philippines. In essence, the GRPI serves as an inflation index tailored to gauge how economic forces impact pivotal products and industries within the Philippines, providing valuable insights into the country’s economic dynamics.
About the Philippine Markets Newsletter
“The Monday Macro Report”
When just about anyone can post just about anything online, it gets increasingly difficult for an individual investor to sift through the plethora of information available.
Investors need a tool that will help them cut through any biased or misleading information and dive straight into reliable and useful data.
Every Monday, we publish an interesting chart on the Philippine economy and stock market. We highlight data that investors would normally look at, but through the lens of Uniform Accounting, a powerful tool that gets investors closer to understanding the economic reality of firms.
Understanding what kind of market we are in, what leading indicators we should be looking at, and what market expectations are will make investing a less monumental task than finding a needle in a haystack.
Hope you’ve found this week’s macro chart interesting and insightful.
Stay tuned for next week’s Monday Macro report!
Regards,
Angelica Lim
Research Director
Philippine Markets Newsletter
Powered by Valens Research
www.valens-research.com


