
Taking advantage of its high prestige brands, this company’s Uniform ROAs have risen to 20%

The beauty industry continues to bloom amid the pandemic, with demand shifting from cheap, low-quality skincare and makeup products to expensive, high-quality products. Today’s company has grown its high prestige branding through the years to maintain its edge in the global market.
However, as-reported metrics do not seem to fully reflect the effect of this company’s pricing strategy on its returns. Uniform Accounting shows that the business has a better Uniform return on assets (ROA) than you might think.
Also below, Uniform Accounting Embedded Expectations Analysis and the Uniform Accounting Performance and Valuation Tearsheet for the company.
Philippine Markets Daily:
Wednesday Uniform Earnings Tearsheets – Asia-listed Focus
Powered by Valens Research
In times of economic downturn, one of the most logical assumptions is for consumer spending to decline. People also stop spending on big-ticket items such as cars and real estate, to focus more on essential items like household staples and healthcare necessities.
However, a peculiar phenomenon seems to occur during financial crises.
In the 2001 recession, lipstick sales in the United States went up by 11%. Following the 2008 Great Recession, nail polish took the limelight with sales growing double in the United States while premium-oriented food like fine wine and chocolate took over Europe.
This inverse concept is called the lipstick effect, an economic and psychological theory presented by Juliet Shor in 1999. It states that while consumers forgo the Porsche, they will instead splurge on affordable luxuries or feel-good items such as prestige beauty products or premium wines during economic uncertainties to satisfy the human desire for indulgences.
This effect is part of the reason why the beauty industry has remained resilient.
In 2019, the global cosmetics market was valued at a whopping $532 billion. While the COVID-19 pandemic has significantly impacted this number, it still remains a multibillion-dollar industry at $483 billion in 2020. The industry is expected to reach $784 billion by 2025.
For years, Asia has been a key player in the beauty industry, second only to the US, and one of the world’s oldest and leading markets for cosmetic products is Japan. In 2016, the country’s domestic consumers actually had the highest per capita expenditure on cosmetics in the world at $152.
Today, we look into one of Japan’s major beauty companies, KOSÉ Corporation.
Kozaburo Kobayashi founded the multinational company as Kobayashi Unlimited Partnership in 1946 with his son as the chief chemist to manufacture beauty products. With the establishment of its subsidiary Albion Co., Ltd. in 1956, the company entered the premium-quality cosmetics market and expanded into different countries. It then changed its name to KOSÉ Corporation in 1991.
KOSÉ attributes most of its growth to its high prestige branding. Since prestige is linked to consumers’ perception of the brand, this strategy enables the company to comfortably set high prices for its products. This results in higher revenues even during periods of lower demand.
However, the beauty company is not immune to the industry’s headwinds. Notably, the company’s domestic sales actually fell by 5% in early 2019, caused mainly by Japan’s aging population. Fortunately, due to increasing demand for prestige beauty products in Asia overall, the company experienced a 38.4% increase in sales.
One of KOSÉ’s high prestige brands, Cosme Decorté, has garnered popularity with its skincare line in the domestic and overseas market through word-of-mouth from tourists in Japan. The brand has been one of the biggest contributors in KOSÉ’s cosmetic business, recording a 56% sales growth in Q1 2019 and making up 13% of total net sales for the same period.
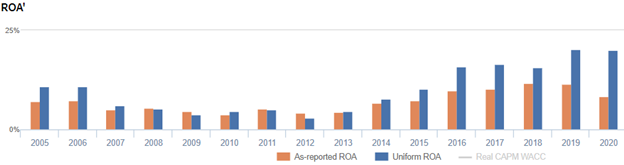
Investors looking at KOSÉ’s legacy and pricing strategy could assume that the company has been achieving high returns. The rising global demand for prestige beauty products should further reinforce that assumption. However, as-reported metrics reflect moderate returns with ROAs ranging only from 4% to 12% in the past eight years.

Using Uniform Accounting, a clearer profitability narrative is uncovered. Specifically, the company’s Uniform returns are actually significantly higher than its as-reported metrics in recent years. For example, while as-reported ROA was only at 8% in 2020, Uniform ROA was actually at 20%.

What as-reported metrics fail to do is to consider the company’s excess cash on the balance sheet. While most companies inherently need some level of cash to operate, the portion of that balance that is earning limited or no return—or excess cash—ends up diluting as-reported ROAs.
When excess cash remains included in the company’s asset base while computing its performance metrics, the company’s profitability and capital efficiency may appear weaker than it actually is. Removing excess cash allows investors to see through the distortions that come from management carrying much more cash on the balance sheet than what is operationally required.
From 2013 to 2020, KOSÉ has had a significant amount of excess cash sitting idly in its balance sheet, ranging from 24% to 32% of its as-reported total assets.
After excess cash and other significant adjustments are made, we can see that KOSÉ’s returns are actually a lot stronger than what as-reported metrics show. Without these adjustments, it appears that the company hasn’t been benefiting from its expansion investments, leading to significantly poorer valuations.
KOSÉ’s profitability is more robust than you think
As-reported metrics are distorting the market’s perception of the firm’s profitability. If you were to just look at as-reported ROA, you would think that the company is a weaker business than real economic metrics reveal.
KOSÉ’s Uniform ROA has been higher than its as-reported ROA in the past eight years. For example, when Uniform ROA was at 20% in 2019, as-reported ROA was only 12%.
The company’s Uniform ROA for the past eight years has ranged from 5% to 20%, while as-reported ROA has ranged only from 4% to 12% in the same timeframe.
Specifically, Uniform ROA gradually improved from 5% in 2013 to 16% levels in 2016 to 2018. It then further rose to 20% levels in 2019 to 2020.
KOSÉ’s Uniform earnings margins are weaker than you think but its robust Uniform asset turns make up for it
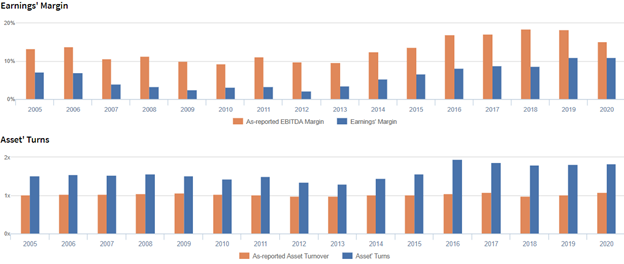
Volatility in Uniform ROA has been driven by trends in both Uniform earnings margins and Uniform asset turns, with peaks and troughs lining up historically with that of Uniform ROA.
Uniform margins steadily expanded from 4% in 2013 to 8% in 2016, before remaining at 9% levels from 2017 to 2018. It then went up further to 11% in 2019 and 2020.
Meanwhile, Uniform turns gradually rose from 1.3x in 2013 to peak levels at 2.0x in 2016. It then contracted to 1.8x levels in 2018-2020.
SUMMARY and KOSÉ Corporation Tearsheet
As the Uniform Accounting tearsheet for KOSÉ Corporation (4922:JPN) highlights, the Uniform P/E trades at 50.5x, which is above the global corporate average of 25.2x and in line with its own historical average of 53.0x.
High P/Es require high EPS growth to sustain them. In the case of KOSÉ, the company has recently shown a 13% Uniform EPS decline.
Sell-side analysts provide stock and valuation recommendations that in general provide very poor guidance or insight. However, sell-side analysts’ near-term earnings forecasts tend to have relevant information.
We take sell-side forecasts for Japan’s Modified International Standards (JMIS) earnings and convert them to Uniform earnings forecasts. When we do this, KOSÉ’s sell-side analyst-driven forecast is a 77% EPS decline in 2021 and a 124% EPS growth in 2022, respectively.
Based on the current stock market valuations, we can use earnings growth valuation metrics to back into the required growth rate to justify KOSÉ’s JPY 16,200 stock price. These are often referred to as market embedded expectations.
KOSÉ is currently being valued as if Uniform earnings were to grow 4% annually over the next three years. What sell-side analysts expect for KOSÉ’s earnings growth is below what the current stock market valuation requires in 2021 but above that requirement in 2022.
Furthermore, the company’s earning power is 4x above the long-run corporate average. Also, cash flows and cash on hand are 4x above its total obligations—including debt maturities, and capex maintenance. All in all, this signals a low credit and dividend risk.
To conclude, KOSÉ’s Uniform earnings growth is below its peer averages, and the company is also trading above its average peer valuations.
About the Philippine Markets Daily
“Wednesday Uniform Earnings Tearsheets – Asia-listed Focus”
Some of the world’s greatest investors learned from the Father of Value Investing or have learned to follow his investment philosophy very closely. That pioneer of value investing is Professor Benjamin Graham. His followers:
Warren Buffett and Charles Munger of Berkshire Hathaway; Shelby C. Davis of Davis Funds; Marty Whitman of Third Avenue Value Fund; Jean-Marie Eveillard of First Eagle; Mitch Julis of Canyon Capital; just to name a few.
Each of these great investors studied security analysis and valuation, applying this methodology to manage their multi-billion dollar portfolios. They did this without relying on as-reported numbers.
Uniform Adjusted Financial Reporting Standards (UAFRS or Uniform Accounting) is an answer to the many inconsistencies present in GAAP and IFRS, as well as in PFRS.
Under UAFRS, each company’s financial statements are rebuilt under a consistent set of rules, resulting in an apples-to-apples comparison. Resulting UAFRS-based earnings, assets, debts, cash flows from operations, investing, and financing, and other key elements become the basis for more reliable financial statement analysis.
Every Wednesday, we focus on one company listed in Asia that’s relevant to the Philippines and that’s particularly interesting from a UAFRS vs as-reported standpoint. We highlight one adjustment that illustrates why the as-reported numbers are unreliable.
This way, we gain a better understanding of the factors driving a particular stock’s returns, and whether or not the firm’s true profitability is reflected in its current valuations.
Hope you’ve found this week’s Uniform Earning Tearsheet on an Asian company interesting and insightful.
Stay tuned for next week’s Asia company highlight!
Regards,
Angelica Lim
Research Director
Philippine Markets Daily
Powered by Valens Research
www.valens-research.com


