
The emperor of brandy is expanding its empire with Uniform returns doubling as-reported ROA

This company’s ability to serve consumers from different locations and demographics enabled it to maximize sales opportunities and offset losses during quarantine restrictions.
Although as-reported metrics show meager but sustainable earnings for its impressive performance, TRUE UAFRS-based (Uniform) return on assets reveals that the company has actually recorded more than twice its returns.
Also below, Uniform Accounting Embedded Expectations Analysis and the Uniform Accounting Performance and Valuation Tearsheet for the company.
Philippine Markets Daily:
Tuesday Uniform Earnings Tearsheets – Philippine-listed Focus
Powered by Valens Research
In our previous article, we mentioned how Emperador ventured into numerous acquisitions, making them the largest brandy company in the world.
With a PHP 145 billion market capitalization, Emperador’s large scale was one of the main reasons it was included in the 30-member benchmark Philippine Stock Exchange Index (PSEi) in August 2020.
Even during the pandemic, the company was able to sustain its robust financial performance. The company’s diverse offerings, from affordable brandy products to luxurious whisky products, put it in a great position to take advantage of shifting consumer trends dependent on the economic environment.
In 2020, the company recorded strong revenues of PHP 52.8 billion, largely due to its international business. Then in Q1 2021, it reported PHP 12.1 billion in revenues, outperforming forecasts.
The Emperador brand was able to maintain its market presence internationally by driving sales from retail outlets and e-commerce.
The brandy business grew substantially in different parts of the world such as the UK, Mexico, Canada, and the US.
Emperador’s scotch business expanded in China, while its scotch whisky became the second-largest selling blended scotch brand in the UK market.
Altogether, the company was able to capitalize on its presence and come out strong in its markets across North America, Latin America, Europe, and Asia.
However, the pandemic has challenged the company with higher sourcing and logistics costs. Various quarantine restrictions around the world will also affect brandy sales going forward with the continued rise of COVID cases.
Despite this, Emperador remains optimistic about sustaining its momentum and current market position and growth initiatives.
The company had recently overspent its planned capex for 2021 by 50% with the aim to maximize its global expansion opportunities. It is also currently working on its secondary listing in the Singapore market.
Regarded as a major financial center in Asia, the robust Singaporean capital market could help raise Emperador’s profile in the international market. It could also help capitalize on more financing opportunities in achieving sustainable growth.
However, it looks like the market may not be entirely convinced of Emperador’s capability for international expansion as its profitability continues to remain barely above the cost of capital levels.

In reality, Uniform ROA shows a better performance, with Uniform ROA remaining at 11% levels. The difference between as-reported ROA and Uniform ROA is the difference between a profitable company that could potentially list in a foreign country and a company earning just enough to cover its cost of capital.
A contributing factor that led to the misstatement of as-reported metrics is the failure to consider current liabilities in the profitability calculation.
Traditional ROA calculations for measuring a firm’s earning power only include current and long-term assets as part of the cost of investment.
However, a company’s ability to receive goods and services in advance of payments – the current operating liabilities – ought to be factored in as well.
Current liabilities (excluding short-term debt) are necessary for operations. Items such as accounts payable, accrued expenses, and others are used to maintain the firm’s current capital position. On the other hand, long-term liabilities are mostly just used to finance the business.
If a company has a ton of cash to service its current liabilities and we only factor in its cash, it would make the company look inefficient. In reality, the company is just being responsible for building liquid assets to meet short-term obligations.
As such, net working capital (current assets – current liabilities) is used for the firm’s ROA calculation. This shows a company’s real cash management ability and thereby, its true earning power.
When current liabilities are subtracted from Emperador’s assets, along with the many other necessary adjustments made, this leads to an 11% Uniform ROA in 2020.
Emperador’s earning power is stronger than you think

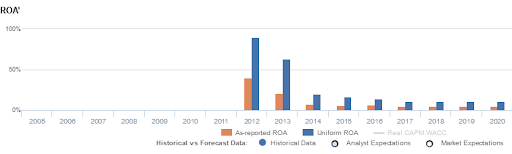
As-reported metrics distort the market’s perception of the firm’s historical profitability. If you were to just look at as-reported ROA, you would think that Emperador’s profitability is lower than what real economic metrics highlight in most years.
In reality, Emperador’s true profitability has generally been higher than its as-reported ROA since 2012.
As-reported ROA gradually declined from 40% in 2012 to 5% levels in 2017-2020.
Meanwhile, Uniform ROA gradually contracted as well from a peak of 90% in 2012 to a range of 11% in 2017-2020.
Emperador’s asset turns are much stronger than you think
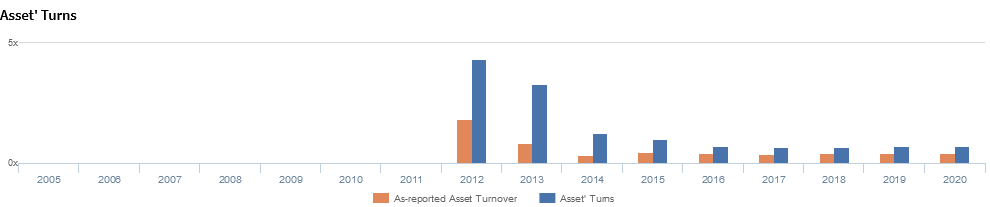
Trends in Uniform ROA have been driven by trends in Uniform asset turns, where Emperador’s earnings remain strong amid the pandemic.
The Uniform asset turns of the firm have trended downwards as well, but not as deep as the as-reported metrics show. The company is generating better sales per peso spent in assets than what traditional metrics imply.
As-reported asset turns peaked at 1.8x in 2012, before dropping to 0.3x-0.4x levels in 2014-2020. Similarly, Uniform turns contracted from a high of 4.3x in 2012 to 0.7x in 2016-2020.
Looking at the firm’s asset turns alone, as-reported metrics significantly understate the market’s perception of the firm’s asset efficiency levels.
SUMMARY and Emperador Inc. Tearsheet
As our Uniform Accounting tearsheet for Emperador Inc. (EMP:PHL) highlights, the company trades at a Uniform P/E of 25.2x, around the global corporate average of 23.7x but above its historical P/E of 20.4x.
Moderate P/Es require moderate EPS growth to sustain them. In the case of Emperador, the company has recently shown a 13% Uniform EPS growth.
Sell-side analysts provide stock and valuation recommendations that in general provide very poor guidance or insight. However, sell-side analysts’ near-term earnings forecasts tend to have relevant information.
We take sell-side forecasts for Philippine Financial Reporting Standards (PFRS) earnings and convert them to Uniform earnings forecasts. When we do this, Emperador’s sell-side analyst-driven forecast is to see Uniform earnings growth of 17% in 2021, before an 11% growth in 2022.
Based on current stock market valuations, we can use earnings growth valuation metrics to back into the required growth rate to justify Emperador’s PHP 13.98 stock price. These are often referred to as market embedded expectations.
The company is currently being valued as if Uniform earnings were to grow 6% annually over the next three years. What sell-side analysts expect for Emperador’s earnings growth is above what the current stock market valuation requires through 2022.
Furthermore, the company’s earning power is 2x the long-run corporate average. Meanwhile, cash flows and cash on hand are above total obligations—including debt maturities, capex maintenance, and dividends. Also, intrinsic credit risk is 200bps above the risk free rate. Together, this signals a low dividend and moderate credit risk.
To conclude, Emperador’s Uniform earnings growth is below its peer averages, but currently trades above its average peer valuations.
About the Philippine Markets Daily
“Tuesday Uniform Earnings Tearsheets – Philippine-listed Focus”
Some of the world’s greatest investors learned from the Father of Value Investing or have learned to follow his investment philosophy very closely. That pioneer of value investing is Professor Benjamin Graham. His followers:
Warren Buffett and Charles Munger of Berkshire Hathaway; Shelby C. Davis of Davis Funds; Marty Whitman of Third Avenue Value Fund; Jean-Marie Eveillard of First Eagle; Mitch Julis of Canyon Capital; just to name a few.
Each of these great investors studied security analysis and valuation, applying this methodology to manage their multi-billion dollar portfolios. They did this without relying on as-reported numbers.
Uniform Adjusted Financial Reporting Standards (UAFRS or Uniform Accounting) is an answer to the many inconsistencies present in GAAP and IFRS, as well as in PFRS.
Under IFRS, each company’s financial statements are rebuilt under a consistent set of rules, resulting in an apples-to-apples comparison. Resulting UAFRS-based earnings, assets, debts, cash flows from operations, investing, and financing, and other key elements become the basis for more reliable financial statement analysis.
Every Tuesday, we focus on one Philippine-listed company that’s particularly interesting from a UAFRS vs as-reported standpoint. We highlight one adjustment that illustrates why the as-reported numbers are unreliable.
This way, we gain a better understanding of the factors driving a particular stock’s returns, and whether or not the firm’s true profitability is reflected in its current valuations.
Hope you’ve found this week’s Uniform Earnings Tearsheet on a Philippine company interesting and insightful.
Stay tuned for next week’s Philippine company highlight!
Regards,
Angelica Lim
Research Director
Philippine Markets Daily
Powered by Valens Research
www.valens-research.com


