
The GPU transformation enabled this company to efficiently synthesize PC and gaming, improving Uniform ROA performance to 30%+

Personal computer (PC) gaming has advanced significantly over the past decades, moving from 2D, pixelated games to the 3D, high-resolution games that we know now. Before that leap, this company ventured into graphics display processors after seeing the potential of PCs as a powerful medium for gaming.
The company made several graphics chips before eventually developing the world’s first graphics processing unit (GPU). This state-of-the-art technology dramatically changed the gaming landscape, specifically in terms of the visual experience.
As-reported data suggests that this innovation did not generate significant returns, with ROAs falling below 10% in half of the last fifteen years. However, Uniform Accounting shows otherwise, with TRUE returns that have consistently stayed past 10%.
Also below, Uniform Accounting Embedded Expectations Analysis and the Uniform Accounting Performance and Valuation Tearsheet for the company.
Philippine Markets Daily:
Thursday Uniform Earnings Tearsheets – Global Focus
Powered by Valens Research
As the popular saying goes, “the bigger the better.” It means that the value of a thing is proportionate to its size, and it applies to most material things—houses, cars, TVs. When it comes to semiconductors, the complete opposite is true.
Semiconductor manufacturers make it a point to design and manufacture the smallest chips possible. Doing so allows them to manufacture more at lower production costs because of how little material it uses. Smaller chips also means smaller transistors, which are much more efficient and faster when it comes to processing.
There are multiple types of semiconductor chips, each serving a specific purpose. Among these are microprocessors (used mainly for CPUs for computer or mobile devices), memory chips (used for storage), and graphics processing units (GPUs) (used for rendering graphics for display on digital devices).
NVIDIA Corporation (NVDA), one of the largest semiconductor companies in the world, specializes in manufacturing GPUs.
It all started with the belief that personal computers (PC) would eventually become an integral part of the technological development for entertainment. Founders Malachowsky, Priem, and Huan were able to see the potential of the nascent market in graphics display processors, all before PC gaming advanced to where it is now.
The company’s first product, NV1, was developed for two years before it was launched in 1995. It was able to handle 2D and 3D videos, complete with an audio processing hardware. Though NV1 was far from perfect, NVIDIA struck a deal with Sega to manufacture these chips for the gaming company’s Saturn console, as well as its gaming controller.
NVIDIA continued to develop new updates for the series with NV2, but potential clients weren’t sold with the idea of purchasing an expensive chip with image and audio performance that just wasn’t exceptional enough. So, the company developed another chip called RIVA 128.
RIVA 128 had a 400% improvement in performance compared to NV2 due to major structural developments in the chip. While this turned out to be a breakout success, it was its successor, RIVA TNT, that put NVIDIA on the map as a highly capable graphics display processors developer.
In 1999, a year after RIVA TNT’s release, NVIDIA invented the GPU and launched the world’s first GPUs with its GeForce line. This later became the most successful innovation it had yet, significantly changing the gaming landscape as we now know it.
This technology enabled users to enjoy several new features, most notably the T&L (Transform and Lighting) engine, which enabled GPUs to perform calculations that were mainly done by CPUs. Essentially, 3D applications perform better with the engine, dramatically increasing the user’s visual experience.
The GeForce chips have had seventeen iterations, each one more innovative than the last, and continues to go through the development and innovation process to provide the best gaming experience possible.
This consistent innovation allowed NVIDIA to make solid partnerships with some of the biggest tech and gaming companies such as Microsoft, Blizzard Entertainment, and Sony.
It’s safe to say that the company’s advanced products and A-list partnerships put it high up the competitive food chain. In fact, a duopoly controls the GPU market, consisting of NVIDIA and its closest competitor, AMD. NVIDIA takes the lead by a far mile though, controlling about 80% of the market share in the discrete GPU space.
As-reported metrics don’t quite capture the company’s leadership brought on by back-to-back successes with its product innovation. Over the past fifteen years, ROA has only ever breached 10% half the time.
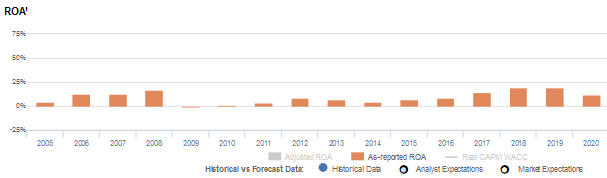
In reality, Uniform Accounting shows that NVIDIA’s profitability has consistently stayed above the 10% level, even reaching new highs of 39% in 2018 when it expanded its GPU chips beyond gaming and into artificial intelligence, cloud computing, and autonomous vehicles.
A source of the distortion between Uniform and as-reported ROAs comes from as-reported metrics incorrectly treating R&D as an expense.
R&D is an investment in the long-term cash flow generation of the company. By recording R&D as an expense, this violates one of the core principles of accounting, which is that expenses should be recognized in the period when the related revenue is incurred.
Since as-reported accounting records R&D on the income statement, as opposed to as an investment on the balance sheet, net income can become materially understated.
NVIDIA materially spends on R&D as it continues to make investments to produce technological developments that are essential to modern computing. The company’s R&D spend has been at least about 60% of total operating costs, significantly distorting the company’s profitability.
After adjustments, we can see that NVIDIA’s Uniform ROA is materially higher than as-reported ROAs. Without this adjustment, it appears that the firm is having less success with its R&D investments than it really is, leading to poorer valuations.
NVIDIA’s earning power is actually more robust than you think
As-reported metrics distort the market’s perception of the firm’s recent profitability. If you were to just look at as-reported ROA, you would think that the company is a much weaker business than real economic metrics highlight.
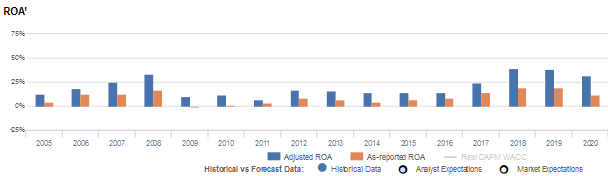
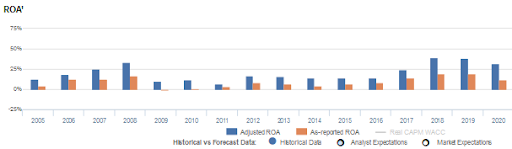
NVIDIA’s Uniform ROA has actually been higher than its as-reported ROA in the past sixteen years. For example, as-reported ROA was 12% in 2020, but its Uniform ROA was actually nearly 3x higher at 32%.
Specifically, NVIDIA’s Uniform ROA has ranged from 7% to 39% in the past sixteen years while as-reported ROA ranged only from -1% to 19% in the same time frame.
After expanding from 12% in 2005 to 34% in 2008, Uniform ROA declined to 7% in 2011 before jumping to 17% in 2012. Then, it maintained at 14%-16% levels through 2016, before expanding to a peak of 39% in 2018. Thereafter, Uniform ROA compressed to 32% in 2020.
NVIDIA’s Uniform earnings margins are generally weaker than you think, but its Uniform asset turns slightly make up for it
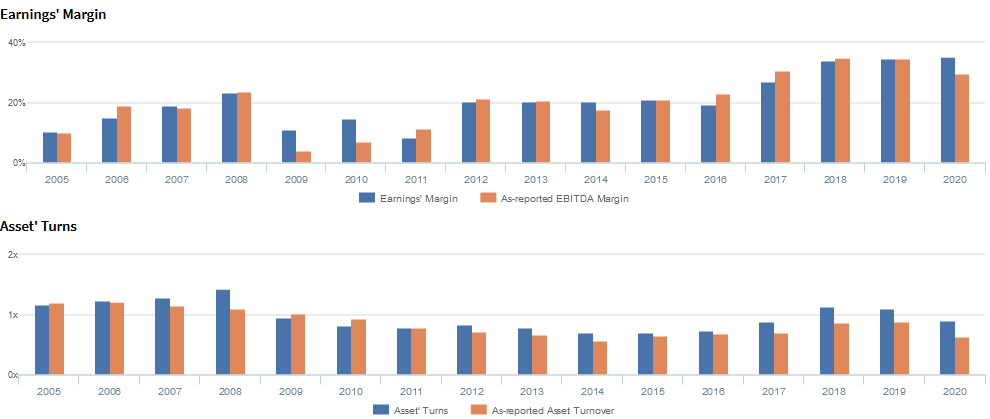
NVIDIA’s trends have been driven by trends in Uniform earnings margins and to a lesser extent, Uniform asset turns.
From 2005-2008, Uniform margins improved from 10% to 24% before falling to a low of 8% in 2011 and recovering to 19%-21% levels through 2016. Since then, Uniform margins have expanded to 35% peaks in 2019-2020.
Meanwhile, Uniform turns recovered from 1.2x levels in 2005-2006 to 1.4x in 2008, before compressing to 0.7x levels from 2014 through 2016. Afterwards, Uniform turns rebounded to 1.1x in 2018-2019, but have since reverted to 0.9x in 2020.
At current valuations, markets are pricing in expectations for both Uniform margins and turns to expand to new peaks.
SUMMARY and NVIDIA Tearsheet
As the Uniform Accounting tearsheet for NVIDIA Corporation (NVDA) highlights, the Uniform P/E trades at 60.7x, which is above corporate average valuation levels and its own recent history.
High P/Es require high EPS growth to sustain them. In the case of NVIDIA, the company has recently shown a 4% Uniform EPS contraction.
Wall Street analysts provide stock and valuation recommendations that in general provide very poor guidance or insight. However, Wall Street analysts’ near-term earnings forecasts tend to have relevant information.
We take Wall Street forecasts for GAAP earnings and convert them to Uniform earnings forecasts. When we do this, NVIDIA’s Wall Street analyst-driven forecast is a 26% and 23% EPS growth in 2021 and 2022, respectively.
Based on current stock market valuations, we can use earnings growth valuation metrics to back into the required growth rate to justify NVIDIA’s $550 stock price. These are often referred to as market embedded expectations.
The company needs Uniform earnings to grow 31% each year over the next three years to justify current prices. What Wall Street analysts expect for NVIDIA’s earnings growth is below what the current stock market valuation requires in 2020 and 2021.
Furthermore, the company’s earning power is 5x the corporate average. Also, cash flows and cash on hand are 5x higher than its total obligations—including debt maturities, capex maintenance, and dividends. Together, this signals a low credit and dividend risk.
To conclude, NVIDIA’s Uniform earnings growth is above its peer averages in 2020, and the company is also trading above its average peer valuations.
About the Philippine Market Daily
“Thursday Uniform Earnings Tearsheets – Global Focus ”
Some of the world’s greatest investors learned from the Father of Value Investing or have learned to follow his investment philosophy very closely. That pioneer of value investing is Professor Benjamin Graham. His followers:
Warren Buffett and Charles Munger of Berkshire Hathaway; Shelby C. Davis of Davis Funds; Marty Whitman of Third Avenue Value Fund; Jean-Marie Eveillard of First Eagle; Mitch Julis of Canyon Capital; just to name a few.
Each of these great investors studied security analysis and valuation, applying this methodology to manage their multi-billion dollar portfolios. They did this without relying on as-reported numbers.
Uniform Adjusted Financial Reporting Standards (UAFRS or Uniform Accounting) is an answer to the many inconsistencies present in GAAP and IFRS, as well as in PFRS.
Under UAFRS, each company’s financial statements are rebuilt under a consistent set of rules, resulting in an apples-to-apples comparison. Resulting UAFRS-based earnings, assets, debts, cash flows from operations, investing, and financing, and other key elements become the basis for more reliable financial statement analysis.
Every Thursday, we focus on one multinational company that’s particularly interesting from a UAFRS vs as-reported standpoint. We highlight one adjustment that illustrates why the as-reported numbers are unreliable.
This way, we gain a better understanding of the factors driving a particular stock’s returns, and whether or not the firm’s true profitability is reflected in its current valuations.
Hope you’ve found this week’s Uniform earnings tearsheet on a multinational company interesting and insightful.
Stay tuned for next week’s multinational company highlight!
Regards,
Angelica Lim
Research Director
Philippine Markets Daily
Powered by Valens Research
www.valens-research.com


