The online travel space was once dominated by this company, but growing competition sank its Uniform ROA to its lowest level in fifteen years

The digital revolution gave rise to the travel industry’s greatest disruptors: online travel agencies. Much of the success of these companies are attributed to high demand fueled by increasing online traffic and high visibility.
To sustain this demand, this online travel agency invests billions of dollars in Google so it would appear as one of the first few results of any travel-related search. When Google saw how profitable this business became, it decided to enter the space and compete directly with this company.
While as-reported metrics show that the impact on this company’s business wasn’t as bad as it feared, in reality, Uniform Accounting shows that the increased competition actually sank profitability to new lows.
Also below, Uniform Accounting Embedded Expectations Analysis and the Uniform Accounting Performance and Valuation Tearsheet for the company.
Philippine Markets Daily:
Thursday Uniform Earnings Tearsheets – Global Focus
Powered by Valens Research
Digital technology revolutionized the travel industry. This contributed significantly to the boom in tourism, giving rise to online travel agencies that disrupted the industry by making it easier for people to travel.
In our Philippine Market Dailies’ edition for Marriott, we highlighted how massive the travel industry is, accounting for about 10% of the world’s $8.8 trillion GDP.
However, the entire industry recently ground to a halt when the novel coronavirus became a serious threat. Governments around the world closed their borders, tightened travel regulations, and ordered people to stay home.
Expedia, one of the world’s leading travel companies, is currently struggling to maintain profits and is expecting a slow recovery in the near future.
Its business revolves around the “do it yourself” philosophy by serving as an aggregator of travel information, making it easier for travelers to book airline tickets, hotel reservations, car rentals, and vacation packages.
As the middleman, Expedia earns revenues every time a consumer uses its platform to purchase services from its partner merchants. Therefore, much of the company’s demand is dependent on online traffic and website visibility.
However, it isn’t the only online travel agency available, which means that they would need to invest heavily in marketing and advertising to increase demand.
Appearing near the top of the page is extremely important for businesses that want to be immediately noticed—people are more likely to click the first few links than the ones at the bottom of the search.
Expedia spends billions of advertising dollars to Google to appear as one of the first few results, similar to how other companies would pay to have their products advertised at a primetime slot on national television.
Specifically, a huge piece of Expedia’s annual marketing expense—which recently was about $6 billion—is paid to Google in order to secure the coveted spot.
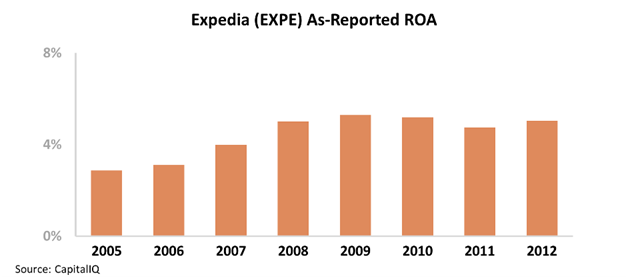
As-reported metrics show that this investment was somewhat beneficial to the company’s returns, with as-reported ROAs rising from 3% in 2005 to 5% in 2012.

However, Uniform Accounting paints a whole different picture. While profitability is still much higher from a Uniform Accounting perspective versus as-reported financials, these marketing expenses have actually led to declining profitability through the years.

This is attributable to two things: significant competition from other online travel agencies and competition from Google itself.
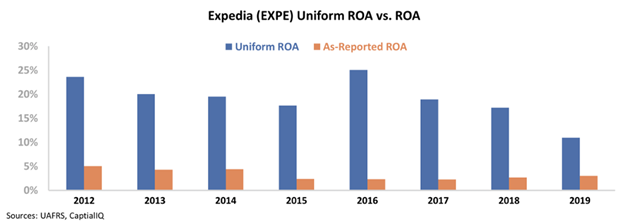
Booking, Expedia’s main competitor, also paid Google for the top search spot and began to gain momentum in 2004-2009 as the top online travel agency. On the opposite end, Expedia lost market share and started to see a massive decline in Uniform ROAs during this period, dropping from 77% in 2005 to 28% in 2009.
The company’s Uniform ROAs further sank below 20% levels when Google saw how profitable the online travel space was and decided to compete directly with Expedia. At this point, Google’s travel services served as an even bigger threat for Expedia as well as its other competitors.

In 2011, Google acquired ITA Matrix Software, an airfare shopping engine, and then launched Google flights in the same year. About eight years later, the search engine giant fully moved into the online travel agency space with the launch of Google Travel.
Much like Expedia and Booking, Google Travel is a search aggregator that allows people to browse through the best and cheapest flights and accommodations.
Furthermore, Google partnered with Sabre, a technology platform that manages more than $260 billion of global travel spend, with both companies working to create “the future of travel.”
With heightened competition from Google essentially disrupting Expedia’s operations, Uniform ROAs further sank to a record-low of just 11%.
However, a Uniform ROA of 10%-20% is still relatively more robust than as-reported ROAs of only 3%. In fact, over the last sixteen years, Uniform ROAs have been 3x-27x greater.
Expedia has made a number of acquisitions over the last decade, with Travelocity and Trivago being the most notable. The distortion comes from as-reported metrics failing to consider the amount of goodwill on Expedia’s balance sheet from these acquisitions, which sits at about $8 billion in recent years.
Goodwill is an intangible asset that is purely accounting-based and unrepresentative of the company’s actual operating performance. When as-reported accounting includes this in a company’s balance sheet, it creates an artificially inflated asset base.
As a result, as-reported ROAs are not capturing the strength of Expedia’s earning power. However, Expedia’s strong profitability doesn’t take away from the fact that it’s fast declining. Continued significant headwinds from Google would most likely help fuel that declining trend.
Expedia’s earning power is actually more robust than you think

As-reported metrics distort the market’s perception of the firm’s recent profitability. If you were to just look at as-reported ROA, you would think that the company is a much weaker business than real economic metrics highlight.
Expedia’s Uniform ROA has actually been higher than its as-reported ROA in the past sixteen years. For example, as-reported ROA was 3% in 2019, but its Uniform ROA was actually almost 4x higher at 11%.
Through Uniform Accounting, we can see that the company’s true ROAs have actually been much higher. Expedia’s Uniform ROA has ranged from 11% to 77% in the past fifteen years while as-reported ROA ranged only from 2% to 5% in the same timeframe.
After falling from a peak of 77% in 2005 to 28% in 2009, Uniform ROA further declined to 18% in 2015, before expanding to 25% in 2016. It then compressed to 11% in 2019.
Expedia’s Uniform earnings margins are weaker than you think, but its robust Uniform asset turns make up for it

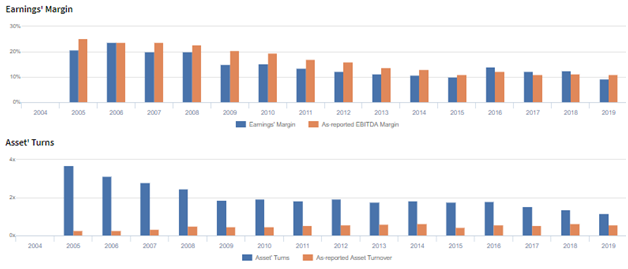
Expedia’s profitability has been driven by trends in Uniform earnings margins and Uniform asset turns.
From 2006-2015, Uniform earnings margins gradually declined from a peak of 24% to 10%, before expanding to 14% in 2016. Then, it compressed to a low of 9% in 2019.
Meanwhile, Uniform turns steadily declined from a peak of 3.7x in 2005 to 1.9x in 2009. It then maintained 1.8x-1.9x levels through 2016, before compressing to 1.2x in 2019.
At current valuations, markets are pricing in an expectation for continued compression for both Uniform margins and Uniform turns.
SUMMARY and Expedia Tearsheet
As the Uniform Accounting tearsheet for Expedia Group, Inc. (EXPE) highlights, the Uniform P/E trades at -10.7x, which is below corporate average valuation levels and its own recent history. The company is forecast to have negative earnings due to the massive decline in global travel.
Negative P/Es require low EPS growth to sustain them. In the case of Expedia, the company has recently shown a 21% Uniform EPS contraction.
Wall Street analysts provide stock and valuation recommendations that in general provide very poor guidance or insight. However, Wall Street analysts’ near-term earnings forecasts tend to have relevant information.
We take Wall Street forecasts for GAAP earnings and convert them to Uniform earnings forecasts. When we do this, Expedia’s Wall Street analyst-driven forecast is a 369% and 104% shrinkage in 2020 and 2021, respectively.
Based on current stock market valuations, we can use earnings growth valuation metrics to back into the required growth rate to justify Expedia’s $78 stock price. These are often referred to as market embedded expectations.
The company needs Uniform earnings to grow immaterially each year over the next three years to justify current prices. What Wall Street analysts expect for Expedia’s earnings growth is far below what the current stock market valuation requires.
Furthermore, the company’s earning power is 2x the corporate average. While cash flows are 2x higher than its total obligations—including debt maturities, capex maintenance, and dividends, intrinsic credit risk is 170bps above the risk free rate. Together, this signals somewhat moderate credit and dividend risk.
To conclude, Expedia’s Uniform earnings growth is below its peer averages in 2020. The company is also trading below average peer valuations.
About the Philippine Market Daily
“Thursday Uniform Earnings Tearsheets – Global Focus”
Some of the world’s greatest investors learned from the Father of Value Investing or have learned to follow his investment philosophy very closely. That pioneer of value investing is Professor Benjamin Graham. His followers:
Warren Buffett and Charles Munger of Berkshire Hathaway; Shelby C. Davis of Davis Funds; Marty Whitman of Third Avenue Value Fund; Jean-Marie Eveillard of First Eagle; Mitch Julis of Canyon Capital; just to name a few.
Each of these great investors studied security analysis and valuation, applying this methodology to manage their multi-billion dollar portfolios. They did this without relying on as-reported numbers.
Uniform Adjusted Financial Reporting Standards (UAFRS or Uniform Accounting) is an answer to the many inconsistencies present in GAAP and IFRS, as well as in PFRS.
Under UAFRS, each company’s financial statements are rebuilt under a consistent set of rules, resulting in an apples-to-apples comparison. Resulting UAFRS-based earnings, assets, debts, cash flows from operations, investing, and financing, and other key elements become the basis for more reliable financial statement analysis.
Every Thursday, we focus on one multinational company that’s particularly interesting from a UAFRS vs as-reported standpoint. We highlight one adjustment that illustrates why the as-reported numbers are unreliable.
This way, we gain a better understanding of the factors driving a particular stock’s returns, and whether or not the firm’s true profitability is reflected in its current valuations.
Hope you’ve found this week’s Uniform earnings tearsheet on a multinational company interesting and insightful.
Stay tuned for next week’s multinational company highlight!
Regards,
Angelica Lim
Research Director
Philippine Markets Daily
Powered by Valens Research
www.valens-research.com


