
This holding company’s diversity banked a Uniform ROA of 6%, not 4%

Diversification in numerous industries allowed this holding company to recover during the pandemic and maintain its market leadership status in various businesses. Historically, this strategy has also resulted in robust profitability, something that as-reported metrics aren’t showing.
Also below, Uniform Accounting Embedded Expectations Analysis and the Uniform Accounting Performance and Valuation Tearsheet for the company.
Philippine Markets Newsletter:
Wednesday Uniform Earnings Tearsheets – Philippine-listed Focus
Powered by Valens Research
In the 1960s, George S. K. Ty established Metropolitan Bank & Trust Company as a means to initially provide financial services to the Filipino-Chinese community. The firm sought to diversify its services in order to give a broad range of products and services to its customers.
Eventually, the company ventured into internationally recognized companies such as Toyota Motor and AXA Group. This increased its growth potential with exposure to the automotive and life insurance industries, respectively.
By 2012, the company was publicly listed as GT Capital Holdings, Inc. (GTCAP:PHL), a holdings company that consolidated interests in Metrobank and other ventures.
Currently, GT Capital has interests in industries such as Property Development (Federal Land), Power Generation (Global Business Power), Nonlife Insurance (Charter Ping An Insurance), Infrastructure and Utilities (Metro Pacific Investments Corporation), and Motorcycle Financing (Sumisho Motor Finance Corporation).
Thanks to its diversification strategy, the company recorded robust growth in 2022. In the first nine months of 2022, GT Capital nearly tripled its income from last year as the strong economic recovery generated high demand for its businesses, namely Metrobank and Toyota Motors.
Metrobank is currently the country’s second largest private universal bank with one of the highest capital ratios in the industry at 17.2%.
Meanwhile, its automotive unit in Toyota Motors grew as new vehicle sales improved due to pent-up demand. As a result, the company holds 49.75% market share for new vehicles sales.
However, despite being on track to reaching their sales target of 160,000 for the year, Toyota Motor may be challenged going forward.
With a combination of global supply chain issues, the weaker peso against the dollar, and inflating costs of materials, the company’s and GT Capital’s profit margins may be at risk of declining going forward.
Looking at the as-reported metrics, GT Capital’s sales continued to produce returns near cost-of-capital levels, implying that the conglomerate has generated little economic value for its stockholders since 2012.

In reality, the company’s performance needs more credit as it profited much better than represented, with profitability reaching a Uniform ROA of 6%.

The distortion between Uniform and as-reported ROAs comes from as-reported metrics failing to consider the amount of non-operating long-term investments on GT Capital’s balance sheet.
These long-term investments are intangible assets that are purely accounting-based and unrepresentative of the company’s actual operating performance. When as-reported accounting includes this in a company’s balance sheet, it creates an artificially inflated asset base.
As a result, as-reported ROAs are not capturing the strength of GT Capital’s earning power. Adjusting for non-operating long-term investments, we can see that the company’s displayed performance is actually misrepresented. In fact, the returns are better than it seems.
GT Capital’s earning power is stronger than you think

As-reported metrics distort the market’s perception of the firm’s recent profitability. If you were to just look at as-reported ROA, you would think that GT Capital Holdings’s profitability has barely improved even after the lows of the pandemic.
Through Uniform Accounting, we can see that the company’s true ROAs have been understated over the past decade. For example, as-reported ROA was 6% in 2021, but its Uniform ROA was higher at 4%.
GT Capital’s Uniform asset turns are stronger than you think
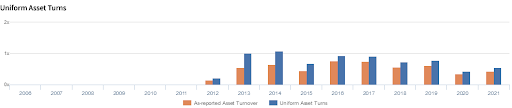
For more than two decades, as-reported metrics have understated GT Capital Holdings’s asset turns, a key driver of profitability.
Moreover, Uniform turns have already reached 1.1x. In comparison, as-reported turns have yet to eclipse beyond 0.9x over the same time period, making the company appear to be a less efficient business than real economic metrics highlight.
SUMMARY and GT Capital Holdings Tearsheet
As our Uniform Accounting tearsheet for GT Capital Holdings, Inc. (GTCAP:PHL) highlights, the company trades at a Uniform P/E of 1.2x, below the global corporate average of 18.4x, and its historical P/E of 4.6x.
Low P/Es require low EPS growth to sustain them. In the case of GT Capital, the company has recently shown a 71% Uniform EPS growth.
Sell-side analysts provide stock and valuation recommendations that in general provide very poor guidance or insight. However, sell-side analysts’ near-term earnings forecasts tend to have relevant information.
We take sell-side forecasts for Philippine Financial Reporting Standards (PFRS) earnings and convert them to Uniform earnings forecasts. When we do this, GT Capital’s sell-side analyst-driven forecast is to see Uniform earnings growth of 56% in 2022, and 13% in 2023.
Based on current stock market valuations, we can use earnings growth valuation metrics to back into the required growth rate to justify GT Capital’s PHP 433.40 stock price. These are often referred to as market embedded expectations.
The company is currently being valued as if Uniform earnings were to shrink by 41% annually over the next three years. What sell-side analysts expect for GT Capital’s earnings growth is above what the current stock market valuation requires through 2023.
Moreover, the company’s earning power is above the long-run corporate average. Moreover, cash flows and cash on hand are 2x above total obligations—including debt maturities, capex maintenance, and dividends. Together, this signals low credit risk.
To conclude, GT Capital’s Uniform earnings growth is above its peer averages, but below its average peer valuations.
About the Philippine Markets Newsletter
“Wednesday Uniform Earnings Tearsheets – Philippine-listed Focus”
Some of the world’s greatest investors learned from the Father of Value Investing or have learned to follow his investment philosophy very closely. That pioneer of value investing is Professor Benjamin Graham. His followers:
Warren Buffett and Charles Munger of Berkshire Hathaway; Shelby C. Davis of Davis Funds; Marty Whitman of Third Avenue Value Fund; Jean-Marie Eveillard of First Eagle; Mitch Julis of Canyon Capital; just to name a few.
Each of these great investors studied security analysis and valuation, applying this methodology to manage their multi-billion dollar portfolios. They did this without relying on as-reported numbers.
Uniform Adjusted Financial Reporting Standards (UAFRS or Uniform Accounting) is an answer to the many inconsistencies present in GAAP and IFRS, as well as in PFRS.
Under IFRS, each company’s financial statements are rebuilt under a consistent set of rules, resulting in an apples-to-apples comparison. Resulting UAFRS-based earnings, assets, debts, cash flows from operations, investing, and financing, and other key elements become the basis for more reliable financial statement analysis.
Every Wednesday, we focus on one Philippine-listed company that’s particularly interesting from a UAFRS vs as-reported standpoint. We highlight one adjustment that illustrates why the as-reported numbers are unreliable.
This way, we gain a better understanding of the factors driving a particular stock’s returns, and whether or not the firm’s true profitability is reflected in its current valuations.
Hope you’ve found this week’s Uniform Earnings Tearsheet on a Philippine company interesting and insightful.
Stay tuned for next week’s Philippine company highlight!
Regards,
Angelica Lim
Research Director
Philippine Markets Newsletter
Powered by Valens Research
www.valens-research.com


