
This “jewel” of global airlines has big bets on the front cabins. Too bad the market already knows it (the true PE is 27x, not 16x as-reported).

Ask Filipino millennials what they would do with their hard-earned money, and you’ll likely hear a good number tell you that they’d use it for travel—locally or internationally.
This increase in appetite to discover the world out there has also given rise to numerous budget airlines servicing more flights in the country.
It has also grabbed the attention of full-service airlines, which opted to offer promo fares more frequently to snag the growing market of budget travelers.
Full-service airlines normally cost twice as much on a base fare basis, so a lot of Filipinos ready themselves at midnight to book those discounted seats.
This particular full-service airline offered promo fares through its tie-ups with various credit card companies, but it’s really their investments and efforts in the front cabin that’s the wind beneath their wings.
Philippine Markets Daily:
Wednesday Uniform Earning Tearsheets – Asia-listed Focus
Powered by Valens Research
The Wright brothers are credited as having made the first successful powered flight of a self-propelled airplane in December 1903. The plane lifted off the ground at 120 feet and remained in the air for 12 seconds.
The fourth and last flight that the Wright brothers conducted that day flew at an altitude of less than 900 feet off the ground and was in flight for 59 seconds.
Nearly 120 years later, flights can take as long as 19 hours and glide at 35,000 feet above sea level.
In October 2019, Qantas Dreamliner completed the longest commercial flight ever, clocking in 19 hours and 16 minutes of flight time from New York’s JFK airport to Sydney international airport.
It was a test flight with a total of 50 passengers and crew onboard. They wanted to see if a non-stop 17,000-kilometer flight would be a viable option for them in the future.
Qantas’ primary purpose for the test flight was to conduct research that would give them more insight to the state of passengers and crew during long-haul non-stop flights. They were interested in learning how to improve the health and wellness of all those aboard.
One other airline, however, holds the record for the longest non-stop commercially available flight still in operations today.
Singapore Airlines relaunched their SQ 21 flights—whose route is from New York Newark International Airport to Singapore Changi Airport—in October 2018 after a 5-year hiatus due to profit concerns.
The total flight time is normally at 18 hours and 30 minutes, and its return flight SQ 22 logs about 17 hours in the air.
As Singapore’s flag carrier airline, it was considered the world’s best airline in 2018 but fell to the number two spot in 2019, giving way to Qatar Airways, which had previously placed second.
Singapore Airlines has won other awards and distinctions for its cabin crew and first-class seats. They have continued to push the boundaries of what can be considered attainable comfort in the air.
This endeavor isn’t surprising, especially with their $30mn budget for wine and champagne.
Singapore Airlines Embedded Expectations Analysis – Market expectations are for Uniform ROA to stabilize at 3%, and the market may be pricing in expectations for Singapore Airlines’ brand management and sustainability initiatives
Singapore Airlines is trading at a much higher valuation than you think

Singapore Airlines Limited (C6L:SGP) currently trades at recent averages, with a 27.0x Uniform P/E (blue bars). Uniform metrics show that the firm has not reached the historically low valuation levels that as-reported P/Es show (orange bars).
At these levels, the market is pricing in expectations for Uniform ROA to remain below cost-of-capital levels, accompanied by 6% Uniform Asset growth going forward.
Analysts have similarly bearish expectations, projecting Uniform ROA to remain at 3% levels through 2020, accompanied by 11% Uniform Asset growth.
Singapore Airlines’ profitability has recovered much better than you think
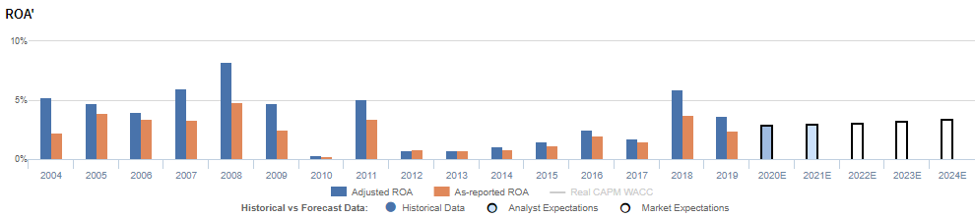
Singapore Airlines has historically seen somewhat volatile profitability, with Uniform ROA ranging from a high of 8% to a low of 0% over the past 16 years.
From 2004 to 2006, Uniform ROA remained at 4% to 5% levels. It then improved to 8% levels in 2008, but fell to 5% in 2009, only to drop further to 0% in 2010, driven by weakening demand related to the global economic downturn and the outbreak of Influenza A(H1N1).
The firm was able to recover in 2011, seeing Uniform ROA rebound to 5%. However, amidst persistent high fuel prices and weak economic conditions, the firm’s profitability declined and ranged around 1%-3% levels from 2012 to 2017. Uniform ROA increased to 6% in 2018 before falling back to 4% in 2019.
Meanwhile, Uniform Asset growth has also been volatile, positive in just nine of the past 16 years, while ranging from -18% to 31%.
As-reported metrics are understating Singapore Airlines’ profitability
For example, as-reported ROA was near 2% levels in 2019, lower than the Uniform ROA of 4%, making the company appear to be a weaker business than real economic metrics highlight.
Moreover, as-reported ROA has been below Uniform ROA for the past 16 years, except for 2012, significantly distorting the market’s perception of the firm’s historical profitability trends.
Singapore Airlines’ margins are just half of what you think
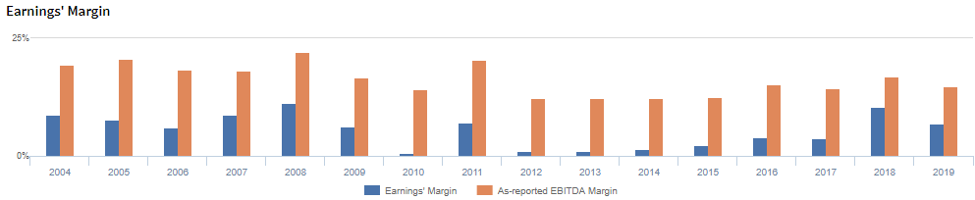
Volatility in Uniform ROA has been driven by volatile Uniform Earnings Margin, with peaks and troughs lining up historically with the timing of peaks and troughs in Uniform ROA.
From 2004 to 2006, Uniform Earnings Margin declined from 9% to 6%, before rebounding to its all-time high of 11% by 2008. It then declined to 1% by 2010 and rebounded again to 7% in 2011, after which it failed to recover to prior peaks and instead fell to 1% in 2012.
It has ranged from 1%-4% from 2013 to 2017 before rising to 10% in 2018 and falling back again to 7% in 2019.
Uniform Asset Turns have been far more stable, ranging between 0.5x and 0.7x over the past 16 years, although it is currently sitting at the lower end of this range. At current valuations, markets are pricing in expectations for both Uniform Margins and Uniform Turns to remain relatively weak going forward.
SUMMARY and Singapore Airlines Tearsheet
As the Uniform Accounting tearsheet for Singapore Airlines Ltd. highlights, Singapore Airlines’ Uniform P/E trades at 27.0x, above market average valuations and at its median levels.
High P/E’s require high EPS growth to sustain them. In the case of Singapore Airlines, the company has recently shown a 37% decline in Uniform EPS growth.
Sell-side analysts provide stock and valuation recommendations that in general provide very poor guidance or insight. However, sell-side analysts’ near-term earnings forecasts tend to have relevant information.
We take sell-side forecasts for SFRS earnings and convert them to Uniform earnings forecasts. When we do this, Singapore Airlines’ sell-side analyst-driven forecast is for Uniform earnings to decline by 13% in 2020. It then rebounds with only 14% growth in 2021.
Based on current stock market valuations, we can back into the required earnings growth rate that would justify SGD 9 per share. These are often referred to as market embedded expectations. In order to meet the current market valuation levels of Singapore Airlines, the company would have to have Uniform earnings grow by 4% each year over the next three years.
What sell-side analysts expect for Singapore Airlines’ earnings growth falls far below what the current stock market valuation requires.
To conclude, Singapore Airlines’ Uniform earnings growth is below peer averages in 2020. Yet, the company is trading at well above average peer valuations.
The company’s earning power, based on its Uniform return on assets calculation, is below average as well. However, with cash flows and cash on hand consistently exceeding obligations, Singapore Airlines has low credit and dividend risk.
About the Philippine Market Daily
“Wednesday Uniform Earning Tearsheets – Asia-listed Focus”
Some of the world’s greatest investors learned from the Father of Value Investing himself, Benjamin Graham.
Each of the great investors studied security analysis and valuation. They have applied Graham’s methodology to amass fortunes managing their multi-billion dollar portfolios.
But what sets them apart from everyone else who also uses financial statements and valuation to choose their investments?
These great investors don’t rely on as-reported numbers.
“… although accounting is the starting place, it’s only a crude approximation.” – Charlie Munger
“… the net earnings figure… it really is not representative of what’s going on in the business at all.” – Warren Buffett, Opening Remarks, the 2018 Berkshire Hathaway Annual Shareholders Meeting
“GAAP rules… I’ve warned you about the distortions. The bottom line figures… totally capricious. It’s really a shame.” – Warren Buffett, Opening Remarks, the 2019 Berkshire Hathaway Annual Shareholders Meeting
“Generally Accepted Accounting Principles are not truth or reality.” – Marty Whitman
Due to the multiple distortions and miscategorizations in GAAP and IFRS, investors are often unable to properly analyze companies in an apples-to-apples comparison.
Uniform Adjusted Financial Reporting Standards (UAFRS or Uniform Accounting) is an answer to the many inconsistencies present in GAAP and IFRS.
The goal of UAFRS is to create reliable and comparable reports of corporate financial activity.
Under UAFRS, each company’s financial statements are rebuilt under a consistent set of rules, resulting in an apples-to-apples comparison. Resulting UAFRS-based earnings, assets, debts, cash flows from operations, investing, and financing, and other key elements become the basis for more reliable financial statement analysis.
Every Wednesday, we focus on one company listed in Asia that’s relevant to the Philippines and that’s particularly interesting from a UAFRS vs as-reported standpoint. We highlight one adjustment that illustrates why the as-reported numbers are unreliable.
This way, we gain a better understanding of the factors driving a particular stock’s returns, and whether or not the firm’s true profitability is reflected in its current valuations.
Hope you’ve found this week’s Uniform Earning Tearsheet on an Asian company interesting and insightful.
Stay tuned for next week’s Asia company highlight!
Regards,
Angelica Lim
Research Director
Philippine Markets Daily
Powered by Valens Research
www.valens-research.com


