
This Korean optic lens company is able to capture Uniform returns of 26%+ by leveraging on its R&D competency

This company has been investing in R&D in order to keep up with fast-changing technological advancements.
However, as-reported metrics seem to downplay how this company’s focus on innovation is positively affecting its returns efforts. Uniform Accounting, on the other hand, shows exactly how R&D investments are paying off in terms of Uniform return on assets (ROA).
Also below, Uniform Accounting Embedded Expectations Analysis and the Uniform Accounting Performance and Valuation Tearsheet for the company.
Philippine Markets Daily:
Wednesday Uniform Earnings Tearsheets – Asia-listed Focus
Powered by Valens Research
The camera lens industry is expected to expand from USD 4.28 billion in 2020 to USD 6.19 billion by 2026, according to market research company Mordor Intelligence. Image stabilization, faster processors for digital cameras, and the increase in storage devices capacity and speed are some of the factors that are pushing the market to evolve.
Moreover, the need to keep up with the current social media trends for product photography and portrait photography has brought significant growth to the camera lens market.
Specifically in Asia, major players in the camera lens space are ramping up investments in technology. This rapid development is one reason why the region is expected to have the largest market share globally going forward.
Today’s company, a major player in the interchangeable lens space, is taking advantage of current trends by continuously upgrading its products and introducing new offerings in the market.
Founded in 1972, Samyang Optics Co., Ltd., formerly known as Korea WAKO CO., Ltd., focuses on long-term research and development to produce its wide array of high-quality camera lenses that they distribute locally and globally. These lenses have several features that cater to the different needs of their consumers.
With forty years in optical R&D technology, the company has created its own auto-focus (AF) lens series as a response to the growing demand for mirrorless cameras and their complements in 2016.
These AF lenses are customized for major camera mounts like Canon, Sony, and Nikon. While those brands carry their own lenses, their products also come in heftier prices. With Samyang’s AF line, users are provided with cheaper options for their branded cameras.
In 2018, the company also introduced the world’s first third party AF lens dedicated to Canon cameras. This series has now become a highly popular alternative for Canon photographers on a budget. It has also helped increase Samyang’s revenues since Canon has the biggest global share for cameras.
In 2020, Samyang Optics acquired Kavas Co., Ltd. This acquisition lays the foundation for Samyang to enter the thermal imaging industry as it leverages its R&D competency with Kavas’ technology for overall thermal imaging camera systems.
Considering the company’s R&D expertise in a market driven by innovation, one could expect the company to stay ahead of its competition, garnering high returns. As-reported metrics show that, with as-reported ROAs ranging from 20% to 35% levels.
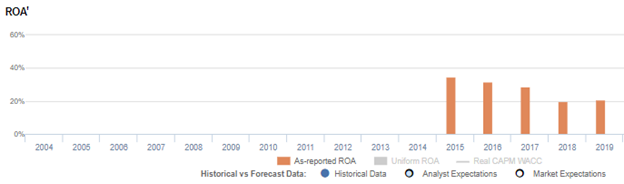
However, Uniform Accounting reveals that the company’s Uniform returns have been consistently more robust than what as-reported metrics show. For example, Uniform ROA was actually at 26% in 2019, which is stronger than the 21% as-reported.

One key metric that causes distortions in as-reported ROAs is R&D expenses.
We have highlighted how Samyang Optics prioritizes its research and development strategies to continuously improve its offerings. In as-reported metrics, these investments in R&D were recorded as outright expenses. Because of this, as-reported metrics fail to follow the accounting principle that expenses should be recognized in the period when the related revenue is incurred. This distorts the company’s earning power.
R&D investment is actually an investment in the long-term cash flow generation of the company. If this remains treated as an expense, the company’s profitability may appear substantially weaker than it actually is.
From 2014 to 2019, Samyang Optics’ R&D expense ranges from KRW 641 million to KRW 1. 7 billion. After accounting for R&D and other adjustments, Uniform earnings ranged from KRW 13.5 billion to KRW 19.7 billion, while Uniform net assets ranged from KRW 24.8 billion to KRW 55.2 billion.
After R&D and other adjustments are made, we can see that the company’s profitability is actually stronger than what as-reported metrics show. Without these adjustments, the firm’s returns wouldn’t be reflecting its success in its R&D investments, leading to poorer, inaccurate valuations.
Samyang Optics’ profitability is more robust than you think
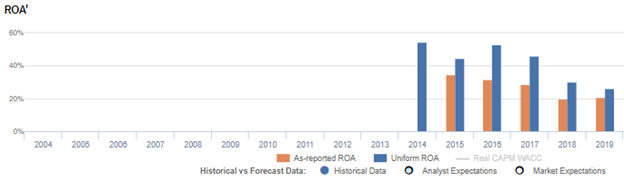
As-reported metrics are distorting the market’s perception of the firm’s profitability. If you were to just look at as-reported ROA, you would think that the company is a weaker business than real economic metrics reveal.
Samyang Optics’ Uniform ROA has been higher than its as-reported ROA in the past six years. For example, when Uniform ROA was at 53% in 2016, as-reported ROA was only 32%.
The company’s Uniform ROA for the past six years has ranged from 26% to 55%, while as-reported ROA has ranged only from 20% to 35% in the same timeframe.
Specifically, Uniform ROA fell from 55% in 2014 to 45% in 2015, before recovering to 53% in 2016. It then gradually declined to 26% in 2019.
Samyang Optics’ Uniform asset turns are weaker than you think

Volatility in Uniform ROA has been driven by trends in Uniform asset turns, with peaks and troughs lining up historically with that of Uniform ROA.
As-reported asset turnover decreased from 1.7x in 2014 to 1.3x in 2019.
Meanwhile, Uniform turns fell from 2.1x in 2014 to 1.7x in 2015, before rebounding to 1.9x in 2016. It then gradually declined to 1.2x in 2019.
SUMMARY and Samyang Optics Co., Ltd. Tearsheet
As the Uniform Accounting tearsheet for Samyang Optics Co., Ltd. (225190:KOR) highlights, the Uniform P/E trades at 6.7x, which is below the global corporate average of 25.2x and its own historical average of 9.3x.
Low P/Es require low EPS growth to sustain them. That said, in the case of Samyang Optics, the company has recently shown an immaterial Uniform EPS decline.
Sell-side analysts provide stock and valuation recommendations that in general provide very poor guidance or insight. However, sell-side analysts’ near-term earnings forecasts tend to have relevant information.
We take sell-side forecasts for Korean International Financial Reporting Standards (K-IFRS) earnings and convert them to Uniform earnings forecasts. When we do this, Samyang Optics’ sell-side analyst-driven forecast is a 3% and 1% EPS decline in 2020 and 2021, respectively.
Based on the current stock market valuations, we can use earnings growth valuation metrics to back into the required growth rate to justify Samyang Optics’ KRW 9,150 stock price. These are often referred to as market embedded expectations.
Samyang Optics is currently being valued as if Uniform earnings were to shrink 19% annually over the next three years. What sell-side analysts expect for Samyang Optics’ earnings growth is above what the current stock market valuation requires in 2020 and 2021.
Furthermore, the company’s earning power is 2x above the long-run corporate average. Also, cash flows and cash on hand are significantly above its total obligations—including debt maturities, capex maintenance, and dividends. All in all, this signals a low credit and dividend risk.
To conclude, Samyang Optics’ Uniform earnings growth is above its peer averages, while the company is trading below its average peer valuations.
About the Philippine Market Daily
“Wednesday Uniform Earnings Tearsheets – Asia-listed Focus”
Some of the world’s greatest investors learned from the Father of Value Investing or have learned to follow his investment philosophy very closely. That pioneer of value investing is Professor Benjamin Graham. His followers:
Warren Buffett and Charles Munger of Berkshire Hathaway; Shelby C. Davis of Davis Funds; Marty Whitman of Third Avenue Value Fund; Jean-Marie Eveillard of First Eagle; Mitch Julis of Canyon Capital; just to name a few.
Each of these great investors studied security analysis and valuation, applying this methodology to manage their multi-billion dollar portfolios. They did this without relying on as-reported numbers.
Uniform Adjusted Financial Reporting Standards (UAFRS or Uniform Accounting) is an answer to the many inconsistencies present in GAAP and IFRS, as well as in PFRS.
Under UAFRS, each company’s financial statements are rebuilt under a consistent set of rules, resulting in an apples-to-apples comparison. Resulting UAFRS-based earnings, assets, debts, cash flows from operations, investing, and financing, and other key elements become the basis for more reliable financial statement analysis.
Every Wednesday, we focus on one company listed in Asia that’s relevant to the Philippines and that’s particularly interesting from a UAFRS vs as-reported standpoint. We highlight one adjustment that illustrates why the as-reported numbers are unreliable.
This way, we gain a better understanding of the factors driving a particular stock’s returns, and whether or not the firm’s true profitability is reflected in its current valuations.
Hope you’ve found this week’s Uniform Earning Tearsheet on an Asian company interesting and insightful.
Stay tuned for next week’s Asia company highlight!
Regards,
Angelica Lim
Research Director
Philippine Markets Daily
Powered by Valens Research
www.valens-research.com


