
This real estate company’s drive for progress enabled it to build peak Uniform ROAs of 10%

Cebu has the potential to become the next megacity in the Philippines. However, thanks to the tourism and IT sectors, the city grew much faster than its current infrastructure could handle. One way to turn this into sustainable growth is through property development.
This real estate company’s focus on its property projects, as well as its resilience during the pandemic, enabled it to drive economic growth and Uniform ROAs of around 10%.
Also below, Uniform Accounting Embedded Expectations Analysis and the Uniform Accounting Performance and Valuation Tearsheet for the company.
Philippine Markets Newsletter:
Wednesday Uniform Earnings Tearsheets – Philippine-listed Focus
Powered by Valens Research
For as long as we can remember, Metro Manila has been the only megacity in the Philippines, home to around 14 million residents.
However, Metro Manila’s industrial growth has led it to become an overly congested metropolis, leading the government to turn to other provinces for further development. Not only does this continue to boost infrastructure activity in the country, it also offers more career opportunities for Filipinos outside the nation’s capital.
One of the major cities expected to be the next megacity in the next decade or so is the “Queen City of the South”—Cebu City.
As one of the oldest cities in the Philippines, Cebu has been home to many historical events, from becoming the first capital of the country to almost getting completely wiped out during World War 2.
Through the years, the city has blossomed into one of the top 5 central business districts in the country, with tourism and the IT sector being the main drivers for its economic growth.
However, this economic growth can become a major problem for the city if it is not partnered with effective urban planning.
In order to keep up with its rapid economic growth, the city has to focus on effectively developing its infrastructure, and one part of this improvement is in property development.
Currently, there are two known property developers in the city: Cebu Landmasters, Inc. (CLI:PHL) and Cebu Holdings, Inc. (CHI:PHL).
This week, we are going to focus on the latter, a subsidiary of Ayala Land Inc (ALI:PHL), one of the biggest real estate companies in the country.
Since 1994, Cebu Holdings, Inc. has been able to transform 156 hectares of the city’s land into Cebu’s prime central business districts, including the Cebu Business Park and Cebu I.T. Park.
Maneuvered by its mission and vision, the company aims to be the premier real estate company that shapes the economic and social landscape by sustaining and improving the quality of life of communities in its region.
For one, in April 2020, the company announced its plan to increase its investment in estate development and leasing projects for the next five years.
This includes its ongoing co-living spaces project known as The Flats, which will provide 852 affordable units for lease upon its completion in 2022.
However, Cebu Holdings was hit hard by the pandemic, with revenues dropping from PHP 4.8 billion in 2019 to PHP 2.9 billion in 2020. Despite that, the company was able to cut its total borrowings by PHP 68.9 billion, allowing it to actually survive the pandemic.
Though most of its projects have come to a halt, Cebu Holdings’ partnership project with SM Prime Holdings, Inc (SMPH:PHL) and Ayala Land—South Coast City—remained in progress given that the 26-hectare waterside estate was seen to have the best economic impact for the city in the long run.
On top of that, Cebu Holdings’ potential merger with Ayala Land will allow the Cebu company to benefit more from Ayala’s wider shareholder base and sufficient liquidity.
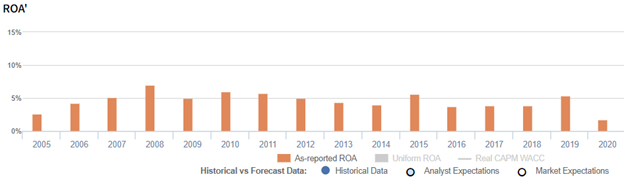
Overall, Cebu Holdings looks strong enough to stand firm against further issues in the near term. However, looking at its as-reported metrics, it seems like the company hasn’t been able to surpass 7% in the past sixteen years.
In reality, its resilience and continued progress have enabled Cebu Holdings to achieve higher ROAs than as-reported, with Uniform ROAs reaching a peak of 10% in recent years.

What as-reported metrics fail to consider is how current liabilities are factored into the ROA calculation. Traditional ROA calculations for measuring a firm’s earning power only include current and long-term assets as part of the cost of investment.
However, a company’s ability to receive goods and services in advance of payments—the current operating liabilities—ought to be factored in as well.
Current liabilities (excluding short-term debt) are necessary for operations. Items such as accounts payable, accrued expenses, and others are used to maintain the firm’s current capital position. On the other hand, long-term liabilities are mostly just used to finance the business.
If a company has a ton of cash to service its current liabilities and we only factor in its cash, it would make the company look inefficient. In reality, the company is just being responsible by building liquid assets to meet short-term obligations.
As such, net working capital (current assets – current liabilities) is used for the firm’s ROA calculation. This shows a company’s real cash management ability and thereby, its true earning power.
In the case of Cebu Holdings, as-reported metrics’ asset base for ROA calculation is at PHP 29.1 billion in 2020, leading to a 2% as-reported ROA.
However, when subtracting current operating liabilities and applying other needed adjustments, we arrive at Cebu Holdings’ PHP 15.8 billion Uniform assets, resulting in a 3% Uniform ROA.
Cebu Holdings’ earning power is stronger than you think
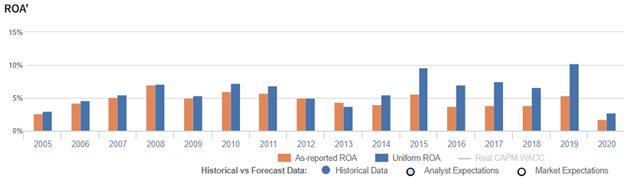
As-reported metrics distort the market’s perception of the firm’s historical profitability. If you were to just look at as-reported ROA, you would think Cebu Holdings’ profitability has been weaker than real economic metrics have highlighted in recent years.
For example, Uniform ROA for Cebu Holdings was 3% in 2020, slightly higher than the as-reported ROA of 2%, making the company appear to be a much weaker business than real economic metrics highlight for the past seven years.
Moreover, after expanding from 3% in 2005 to 7% in 2008, Uniform ROA fell to 4% in 2013. Then, Uniform ROA rebounded to 10% in 2015, before compressing to 7%-8% levels in 2016-2018. Thereafter, Uniform ROA bounced back to 10% in 2019, before collapsing once again to 3% in 2020.
Cebu Holdings’ earnings margin is weaker than you think, but its asset turns make up for it

Trends in Cebu Holdings’ Uniform ROA have been driven by trends in Uniform asset turns, and most recently, trends in Uniform earnings margin.
Uniform turns rose from 0.1x in 2005 to 0.2x-0.3x levels in 2006-2020.
Meanwhile, Uniform margins collapsed from 25% in 2005 to 19%-20% levels in 2006-2007, before improving to 24%-29% levels in 2008-2011. Thereafter, Uniform margins compressed to 18% in 2013, before gradually expanding to a peak of 33% in 2019 and falling to a low of 15% in 2020.
At current valuations, the market is pricing in expectations for both Uniform margins and Uniform turns to remain stable.
SUMMARY and Cebu Holdings, Inc. Tearsheet
As our Uniform Accounting tearsheet for Cebu Holdings, Inc. (CHI:PHL) highlights, the company trades at a Uniform P/E of 15.0x, which is below the global corporate average of 24.0x and its historical P/E of 30.0x.
Low P/Es require low EPS growth to sustain them. In the case of Cebu Holdings, the company has recently shown a 109% Uniform EPS shrinkage.
Sell-side analysts provide stock and valuation recommendations that in general provide very poor guidance or insight. However, sell-side analysts’ near-term earnings forecasts tend to have relevant information.
We take sell-side forecasts for Philippine Financial Reporting Standards (PFRS) earnings and convert them to Uniform earnings forecasts. When we do this, Cebu Holdings’ sell-side analyst-driven forecast is to see a 77% and a 40% Uniform earnings decline in 2021 and 2022, respectively.
Based on current stock market valuations, we can use earnings growth valuation metrics to back into the required growth rate to justify Cebu Holdings’ PHP 6.12 stock price. These are often referred to as market embedded expectations.
The company is currently being valued as if Uniform earnings were to shrink 3% over the next three years. What sell-side analysts expect for Cebu Holdings’ earnings growth is above what the current stock market valuation requires through 2022.
Furthermore, the company’s earning power is below the long-run corporate average. Also, cash flows and cash on hand are below its total obligations—including debt maturities, capex maintenance, and dividends. Overall, this signals a high credit risk.
Lastly, Cebu Holdings’ Uniform earnings growth is below its peer averages but currently trades in line with its average peer valuations.
About the Philippine Markets Newsletter
“Wednesday Uniform Earnings Tearsheets – Philippine-listed Focus”
Some of the world’s greatest investors learned from the Father of Value Investing or have learned to follow his investment philosophy very closely. That pioneer of value investing is Professor Benjamin Graham. His followers:
Warren Buffett and Charles Munger of Berkshire Hathaway; Shelby C. Davis of Davis Funds; Marty Whitman of Third Avenue Value Fund; Jean-Marie Eveillard of First Eagle; Mitch Julis of Canyon Capital; just to name a few.
Each of these great investors studied security analysis and valuation, applying this methodology to manage their multi-billion dollar portfolios. They did this without relying on as-reported numbers.
Uniform Adjusted Financial Reporting Standards (UAFRS or Uniform Accounting) is an answer to the many inconsistencies present in GAAP and IFRS, as well as in PFRS.
Under IFRS, each company’s financial statements are rebuilt under a consistent set of rules, resulting in an apples-to-apples comparison. Resulting UAFRS-based earnings, assets, debts, cash flows from operations, investing, and financing, and other key elements become the basis for more reliable financial statement analysis.
Every Wednesday, we focus on one Philippine-listed company that’s particularly interesting from a UAFRS vs as-reported standpoint. We highlight one adjustment that illustrates why the as-reported numbers are unreliable.
Hope you’ve found this week’s Uniform Earnings Tearsheet on a Philippine company interesting and insightful.
Stay tuned for next week’s Philippine company highlight!
Regards,
Angelica Lim
Research Director
Philippine Markets Newsletter
Powered by Valens Research
www.valens-research.com


