
This retailer continues to strike gold through its pure play grocery business with Uniform ROAs reaching 16%

Grocery stores are one of the few establishments that remained essential during the strict quarantine period. Despite that, the industry still found it challenging to generate pre-pandemic levels of sales.
Although its as-reported metrics showed just stable profitability, this retailer was able to adjust to the pandemic through proper cost management and asset efficiency as its improved Uniform return on assets (ROA) would show.
Also below, Uniform Accounting Embedded Expectations Analysis and the Uniform Accounting Performance and Valuation Tearsheet for the company.
Philippine Markets Newsletter:
Wednesday Uniform Earnings Tearsheets – Philippine-listed Focus
Powered by Valens Research
In 2020, Puregold Price Club, Inc. (PGOLD:PHL) was recognized as one of the 500 high-growth companies in the Asia-Pacific region. It had recorded around 11% compounded annual growth from 2016 to 2019, and even amidst the pandemic, it came out a winner with net income expanding by nearly 19%.
Puregold’s positive performance was largely attributed to robust consumer sales from Puregold stores and S&R thanks to its wide product selection. Its Puregold branded stores offer affordable products, while its S&R Membership Shopping stores provide more luxurious products for its middle- to upper-income class consumers.
To address the decline in foot traffic as more people stayed home, Puregold launched its own mobile app last year so consumers could order online and have their goods delivered. This omni-channel initiative has resulted in the company being well-positioned to capitalize on further growth opportunities going forward, especially as consumers have shifted to online shopping.
Interestingly, the extension of quarantine restrictions has had a negative effect on sales in H1 2021, which dropped by 7% or PHP 5.78 billion. This sales decline may be due to Puregold’s 2020 earnings being pushed either by panic-buying behavior or by the rise of homemade food and beverages that were all the rage earlier in the pandemic.
Through the company’s effective cost management, cost of sales declined by 10% or PHP 6.68 billion, resulting in a 7.5% increase in operating income or PHP 429 million increase.
For now, Puregold is concentrating on its efficiency efforts to mitigate lower consumer spending throughout the pandemic. At the same time, it is continuing to expand its footprint as it plans to open 15 stores and contemplate two more warehouse branches by H2 2021.
Looking at the as-reported metrics, Puregold seems to have experienced generally stable profitability even during the pandemic.
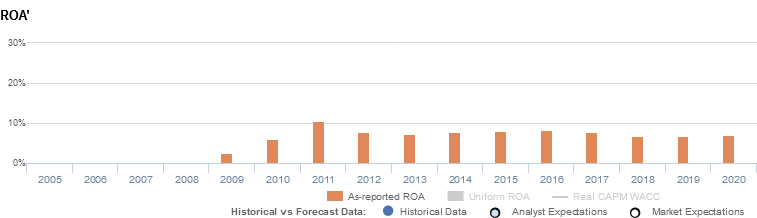
However, Uniform Accounting tells us that this is a misrepresentation of Puregold’s profitability. In fact, the company’s Uniform ROA is far more robust than what the as-reported figures show.

What as-reported metrics fail to do is to consider the company’s excess cash on the balance sheet. While most companies inherently need some level of cash to operate, the portion of that balance that is earning limited or no return—or excess cash—ends up diluting as-reported ROAs.
When excess cash remains included in the company’s asset base in computing its performance metrics, the company’s profitability and capital efficiency may appear weaker than it actually is. Removing excess cash allows investors to see through the distortions that come from management carrying much more cash on the balance sheet than what is operationally required.
For 2020, Puregold had a significant amount of excess cash sitting idly in its balance sheet for up to 20% of its as-reported total assets.
Puregold’s earning power is stronger than you think
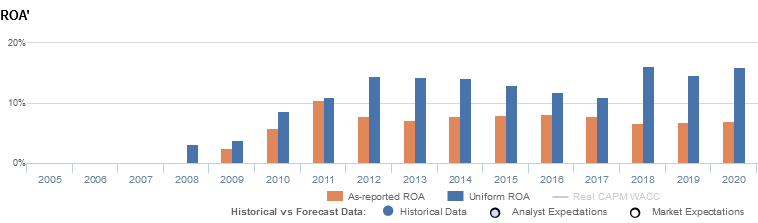
Despite the converging trend, as-reported ROA continues to understate Puregold’s profitability. Uniform ROA of 16% in 2020 is 2x higher than the as-reported ROA of 7%, making Puregold appear to be weaker than real economic metrics highlight.
Historically, Puregold has seen robust profitability. From 2008 to 2012, Uniform ROA improved from 3% to a near peak of 14% levels in 2012-2014 as they acquired S&R. Thereafter, Uniform ROA fell to 11% in 2017, before rebounding to 15% to 16% levels through 2020.
Meanwhile, as-reported ROA will tell you that the company’s performance has performed worse since the aforementioned acquisition and that returns have been stable at 7%-8% levels since 2012.
Puregold’s asset turns are more efficient than you think
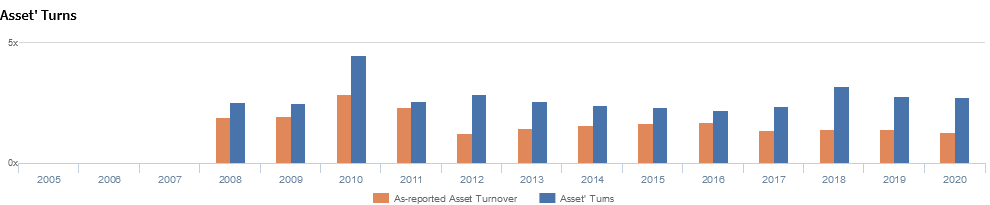
Similarly, as-reported metrics significantly distort Puregold’s asset efficiency, a key driver of profitability.
In the past, as-reported asset turnover has experienced somewhat cyclical trends. After improving from 1.9x in 2008 to 2.9x in 2010, as-reported asset turnover declined to 1.3x in 2012, before rebounding to 1.7x levels in 2015-2016. Since then, as-reported asset turnover has declined to 1.3x in 2020.
Meanwhile, after rising from 2.5x levels in 2008-2009 to 4.5x in 2010, Uniform asset turns contracted to 2.2x in 2016, before recovering to 3.2x in 2018. Then, Uniform asset turns faded to 2.7x in 2020.
This has made the company appear to be a less efficient business than real economic metrics reveal since 2008, distorting the market’s perception of the firm’s historical asset efficiency level.
SUMMARY and Puregold Price Club, Inc. Tearsheet
As our Uniform Accounting tearsheet for Puregold Price Club, Inc. (PGOLD:PHL) highlights, the company trades at a Uniform P/E of 14.9x, below the global corporate average of 21.9x, but around its historical P/E of 13.5x.
Low P/Es require low EPS growth to sustain them. In the case of Puregold, the company has recently shown a 24% Uniform EPS growth.
Sell-side analysts provide stock and valuation recommendations that in general provide very poor guidance or insight. However, sell-side analysts’ near-term earnings forecasts tend to have relevant information.
We take sell-side forecasts for Philippine Financial Reporting Standards (PFRS) earnings and convert them to Uniform earnings forecasts. When we do this, Puregold’s sell-side analyst-driven forecast is to see Uniform earnings grow by 4% and 6% by 2021 and 2022, respectively.
Based on current stock market valuations, we can use earnings growth valuation metrics to back into the required growth rate to justify Puregold’s PHP 41.95 stock price. These are often referred to as market embedded expectations.
The company is currently being valued as if Uniform earnings were to shrink 11% annually over the next three years. What sell-side analysts expect for Puregold’s earnings growth is above what the current stock market valuation requires through 2022.
Furthermore, the company’s earning power is nearly 3x above the long-run corporate average. In addition, cash flows and cash on hand are nearly 4x above total obligations—including debt maturities, capex maintenance, and dividends. Also, intrinsic credit risk is 20bps above the risk-free rate. Together, this signals a low dividend and credit risk.
To conclude, Puregold’s Uniform earnings growth is below its peer averages, and currently trades below its average peer valuations.
About the Philippine Markets Newsletter
“Wednesday Uniform Earnings Tearsheets – Philippine-listed Focus”
Some of the world’s greatest investors learned from the Father of Value Investing or have learned to follow his investment philosophy very closely. That pioneer of value investing is Professor Benjamin Graham. His followers:
Warren Buffett and Charles Munger of Berkshire Hathaway; Shelby C. Davis of Davis Funds; Marty Whitman of Third Avenue Value Fund; Jean-Marie Eveillard of First Eagle; Mitch Julis of Canyon Capital; just to name a few.
Each of these great investors studied security analysis and valuation, applying this methodology to manage their multi-billion dollar portfolios. They did this without relying on as-reported numbers.
Uniform Adjusted Financial Reporting Standards (UAFRS or Uniform Accounting) is an answer to the many inconsistencies present in GAAP and IFRS, as well as in PFRS.
Under IFRS, each company’s financial statements are rebuilt under a consistent set of rules, resulting in an apples-to-apples comparison. Resulting UAFRS-based earnings, assets, debts, cash flows from operations, investing, and financing, and other key elements become the basis for more reliable financial statement analysis.
Every Wednesday, we focus on one Philippine-listed company that’s particularly interesting from a UAFRS vs as-reported standpoint. We highlight one adjustment that illustrates why the as-reported numbers are unreliable.
This way, we gain a better understanding of the factors driving a particular stock’s returns, and whether or not the firm’s true profitability is reflected in its current valuations.
Hope you’ve found this week’s Uniform Earnings Tearsheet on a Philippine company interesting and insightful.
Stay tuned for next week’s Philippine company highlight!
Regards,
Angelica Lim
Research Director
Philippine Markets Newsletter
Powered by Valens Research
www.valens-research.com