
This UITF might not have outperformed the market since its inception, but its holdings are anything but unprofitable companies… also, MER tearsheet

This universal bank’s equity unit investment trust fund (UITF) has underperformed its benchmark, the Philippine Stock Exchange Composite Index (PSEi). The average Uniform ROA for this UITF’s holdings is 4%, almost 1.5x the as-reported average.
Although as-reported metrics would leave investors confused with the fund’s stock picks, Uniform Accounting helps make sense of the fund’s investments and how it continues to outperform the market.
In addition to examining the fund’s portfolio, we are including the fundamental analysis of one of the fund’s largest holdings, providing you with the current Uniform Accounting Performance and Valuation Tearsheet for that company.
Philippine Markets Daily:
Friday Uniform Portfolio Analytics
Powered by Valens Research
Asia United Bank Corporation (AUB), the banking unit of Republic Biscuit Corporation (Rebisco), started operating as a commercial bank in October 1997.
In February 2013, the Bangko Sentral ng Pilipinas (BSP) authorized AUB to operate as a universal bank. As a universal bank, AUB has two additional powers: powers of an investment house that includes securities underwriting, and the power to invest in allied and non-allied enterprises.
AUB has over 250 branches with offerings such as deposit account products, loans, cash management services, and investment products. Their investment products and services include bond funds, equity funds, and money market funds, to cater to the varying risk profiles of their clients.
This week, we’ll be revisiting one of AUB’s funds, the AUB Equity Investment Fund.
The AUB Equity Investment Fund (AUB EIF), established on May 4, 2006, is an equity fund that invests in blue chips and major second line issues included in the Philippine Stock Exchange (PSEi). The fund aims to achieve a rate of return equivalent to the rolling 90-day yield of the PSEi, net of fees.
The fund is suitable for investors who have an aggressive risk appetite, willing to stay invested for at least three years, and who are willing to accept higher volatility of returns and even possible loss of principal.
The fund is currently invested in at least 83% of selected shares of blue chip or second line stocks while the remaining is in cash.
At its inception in May 2006, AUB EIF’s net asset value per unit (NAVPU) was at PHP 100.00.
After rising to PHP 144.95 in July 2007, the fund fell to a historical low of PHP 79.93 in October 2008 in the midst of the global financial crisis. The fund recorded a loss of 45%, slightly outperforming its benchmark, the PSEi, which incurred a loss of 55% over the same period.
The fund’s NAVPU then rose to a peak of PHP 317.94 in January 2018, then dropped 22% to PHP 246.90 in November 2018 due to various concerns such as Brexit and the US-China trade war. Similarly, the PSEi had a loss of 24% in the same time span.
The fund rebounded to a NAVPU of PHP 296.97 by the end of 2019. However, in March 2020, the fund’s NAVPU declined to PHP 184.53 following the market selloff caused by the pandemic, recording a 38% loss that slightly outperformed its benchmark’s 45% loss.
By June 21, 2021, the fund’s NAVPU recovered to PHP 254.35, though this 38% gain underperformed its benchmark’s 48% gain.
Since its inception, AUB EIF has had a cumulative 154% gain, which has underperformed its benchmark’s cumulative 188% gain.
Even though the fund’s performance hasn’t been better than the market’s, it does not mean the companies in its holdings are of lower quality. As-reported metrics would have investors believe that the fund’s portfolio consists of companies that do not generate economic profit. However, Uniform Accounting reveals the truth behind the companies this fund invests in.
The table below shows the top nine core non-financial holdings of the AUB Equity Investment Fund along with its Uniform return on assets (ROA), as-reported ROA, and ROA distortion—the difference between Uniform and as-reported ROA.

Most of the companies in the AUB Equity Investment Fund show as-reported ROAs at or below cost-of-capital levels, suggesting that they are not generating economic profit. The fund is generating an average as-reported ROA of 3%, lower than the global corporate average returns of 6%.
However, on a Uniform Accounting basis, this UITF’s holdings have actually delivered better returns with an average Uniform ROA of 4%, almost 1.5x the average as-reported ROA. Though the average is being pulled down by companies with negative profitability, there are still more companies with above cost-of-capital Uniform ROA than there are with as-reported ROA.
The Uniform Accounting framework addresses financial statement inconsistencies attributable to the flaws present in the Philippine Financial Reporting Standards (PFRS). This enables investors to determine the true underlying performance of companies and avoid distorted financial analysis and valuation.
As such, it should not be surprising that when analyzing the non-financial holdings of the AUB Equity Investment Fund, the figures that easily stand out are the large discrepancies between Uniform ROA and as-reported ROA for these companies.
While at a glance, the difference between as-reported ROA and Uniform ROA may not seem that great, the distortion in percentage ranges from -309% to 134%, with Jollibee Foods Corporation (JFC:PHL), JG Summit Holdings, Inc. (JGS:PHL), and Ayala Corporation (AC:PHL) having the highest distortions.
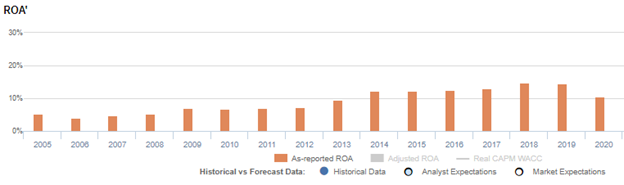
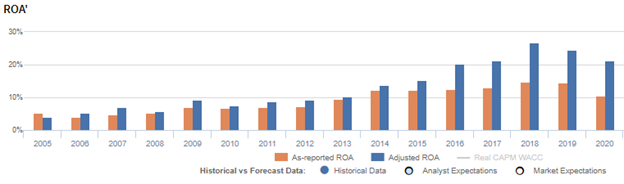
As-reported metrics understate the profitability of Ayala Corporation, suggesting an unprofitable firm with an as-reported ROA of 2%. In reality, this firm more closely resembles one that is breaking even, with a Uniform ROA of 5% that is in line with the average cost of capital. Prior to the pandemic, it consistently generated returns of at least 9% from 2005 to 2019.
By focusing on as-reported metrics alone, these companies look like anything but profitable businesses.
That said, looking at profitability alone is insufficient to deliver superior investment returns. Investors should also identify if the market is significantly undervaluing a company’s earnings growth potential.
This table shows the earnings growth expectations for the major non-financial holdings of the fund. It features three key data points:
- The two-year Uniform earnings per share (EPS) growth represents the Uniform earnings growth the company is likely to have for the next two years. The earnings number used is the value of when we convert consensus sell-side analyst estimates according to the Uniform Accounting framework.
- The market expected Uniform EPS growth represents what the market thinks Uniform earnings growth is going to be for the next two years. Here, we show how much the company needs to grow Uniform earnings in the next two years to justify the current stock price of the company. This is the market’s embedded expectations for Uniform earnings growth.
- The Uniform EPS growth spread is the difference between the 2-year Uniform EPS growth and market expected Uniform EPS growth.
On average, Philippine companies are expected to have 5%-6% annual Uniform earnings growth over the next two years. Meanwhile, AUB Equity Investment Fund’s major holdings are forecast to outperform with a 19% projected Uniform earnings growth in the next two years, while the market is forecasting a drastic underperformance with a 45% projected Uniform earnings shrinkage.
All the companies in the AUB Equity Investment Fund have a positive Uniform earnings growth spread except for Ayala Corporation (AC:PHL) and PLDT, Inc. (TEL:PHL). Among these companies, JG Summit Holdings, Inc. (JGS:PHL), Jollibee Foods Corporation (JFC:PHL), and SM Investments Corporation (SM:PHL) have the highest positive Uniform earnings growth spread.
The market is pricing JGS’ Uniform Earnings to shrink by 244% in the next two years, while sell-side analysts are projecting the company’s earnings to be immaterial.
Likewise, the market is pricing JFC’s Uniform Earnings to shrink by 201% in the next two years, while sell-side analysts are projecting the company’s earnings to be immaterial.
Similarly, the market is pricing SM’s Uniform Earnings to grow by 11% in the next two years, while sell-side analysts are projecting the company’s earnings to grow by 65%.
Overall, as-reported numbers would have investors incorrectly conclude that this portfolio consists of low-quality companies. While these firms suffer from the adverse effects of the coronavirus pandemic, dragging down their short-term earnings growth expectations, Uniform Accounting metrics show that these mature, low growth, but high return companies have intact business models that should drive economic profitability moving forward.
SUMMARY and Manila Electric Company Tearsheet
Today, we’re highlighting one of the individual stock holdings in the AUB Equity Investment Fund—Manila Electric Company (MER:PHL).
As the Uniform Accounting tearsheet for Manila Electric Company highlights, it trades at a Uniform P/E of 27.3x, above the global corporate average of 23.7x, but around its historical average of 28.0x.
High P/Es require high EPS growth to sustain them. In the case of Manila Electric Company, the company has shown a 24% Uniform EPS shrinkage in 2020.
Sell-side analysts provide stock and valuation recommendations that poorly track reality. However, sell-side analysts have a strong grasp on near-term financial forecasts like revenue and earnings.
We take sell-side forecasts for Philippine Financial Reporting Standards (PFRS) earnings as a starting point for our Uniform earnings forecasts. When we do this, Manila Electric Company’s sell-side analyst-driven forecast shows that Uniform earnings are expected to grow by 28% in 2021 and 6% in 2022.
Based on the current stock market valuations, we can back into the required earnings growth rate that would justify MER’s PHP 279.60 stock price. These are often referred to as market embedded expectations.
Manila Electric Company is currently being valued as if Uniform earnings were to grow by 8% per year over the next three years. What sell-side analysts expect for MER’s earnings growth is above what the current stock market valuation requires in 2021 and below what the current stock market valuation requires in 2022.
The company has an earning power below long-run corporate averages, but its cash flows and cash on hand consistently exceed obligations within five years. The company has an intrinsic credit risk of 60bps, indicating that MER has a low credit and dividend risk.
To conclude, Manila Electric Company’s Uniform earnings growth is in line with peer averages, and is trading well above peer average valuations.
About the Philippine Market Daily
“Friday Uniform Portfolio Analytics”
Investors who don’t engage in the buying or selling of securities for a living often rely on professionals to manage their own investments within the scope of their investment policies.
With so many funds and managers out there, it can get confusing and difficult to decide which one best suits your needs as an investor.
Every Friday, we focus on one fund in the Philippines and take a deeper look into their current holdings. Using Uniform Accounting, we identify the high-quality stocks in their portfolio which may not be obvious using the as-reported numbers.
We also identify which holdings may be problematic for the fund’s returns that they would need to reconsider from a UAFRS perspective.
To wrap up the fund analysis, we highlight one of their largest holdings and focus on key metrics to watch out for, accessible in our tearsheets.
Hope you’ve found this week’s focus on AUB Equity Investment Fund interesting and insightful.
Stay tuned for next week’s Friday Uniform Portfolio Analytics!
Regards,
Angelica Lim
Research Director
Philippine Markets Daily
Powered by Valens Research
www.valens-research.com


