
Staples: New Strategies And Fundamental Upside? ‘Yeah, We Got That.’
Summary:
- Staples, Inc. is trading at historically low valuations, but management’s confidence in its new strategies indicates that they may be unwarranted.
- The firm is trading at a 1.0x Adjusted Value-to-Assets Ratio, near its historical lows.
- Despite struggling with declining profitability in recent years, Staples has still succeeded in maintaining ROA’s above cost-of-capital levels.
- This contrasts dramatically with its main competitor, and failed merger partner, Office Depot.
- Considering management’s confidence about its transition to an everyday value strategy and delivery-oriented focus, equity upside may be justified.
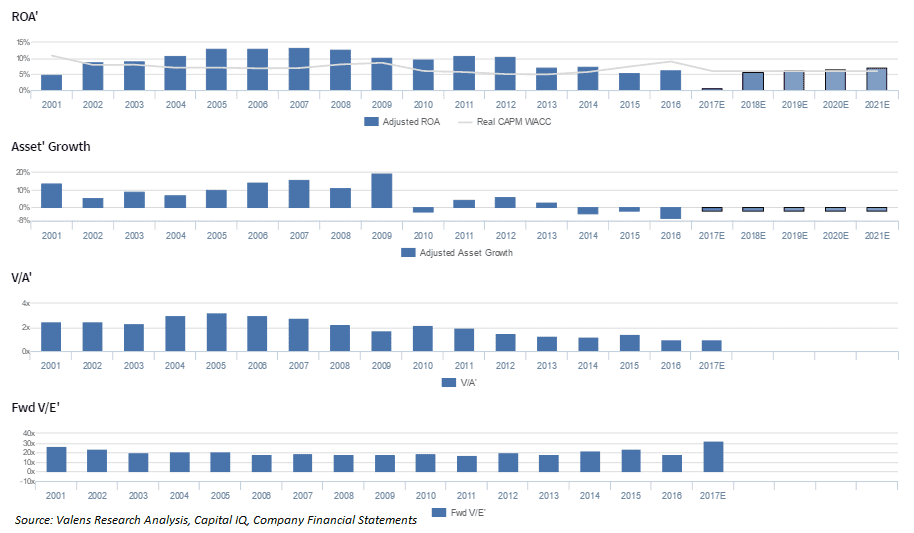
Staples had seen increasing profitability prior to 2008, with Adjusted ROA (ROA’) climbing from 5% in 2001 to a peak of 13% in 2007. However, ROA’ has since declined to 6% in 2016. Meanwhile, Adjusted Asset (Asset’) growth consistently ranged from 5-17% from 2001-2009, but has since dramatically fallen off to -7-4% levels since 2010.
Performance Drivers – Sales, Margins and Turns
It can be helpful to break down ROA’ into its DuPont formula parts, Adjusted Earnings Margin (Earnings’ Margin) and Adjusted Asset Turnover (Asset’ Turns), which are the cleaned up margins and turns metrics used to calculate ROA’. The chart below details both Earnings’ Margin and Asset’ Turns historically, to help us better understand the drivers of the firm’s profitability and performance. The detail behind the chart can be found here.

Valuation Matrix – ROA’ and Asset’ Growth as Drivers of Valuation
When valuing a company, it is important to consider more than a singular target price, and instead the potential value of a firm at various levels of performance. The below matrix highlights potential prices for SPLS at various levels of profitability (in terms of ROA’) and growth (Asset’ growth). Prices that are in excess of 10% equity upside are highlighted in black, and prices representing an excess of 10% equity downside are highlighted in red. To see more about the below chart, and also to be able to input your own scenarios to understand how it impacts valuations, please click here.

Click here to read the article in its entirety at Seeking Alpha, where we also included a discussion of Staples’ performance versus Office Depot and a discussion of their credit profile.


