
The Difference Between a Great Company and a Great Stock
Updated April 21, 2020
Overview
In mid-1998, Coca-Cola’s (KO:USA) stock price traded at a high of about $88 per share. Almost eight years later, the firm’s stock price stood at half that mark: $44. Did the company lose their incredible competitive advantages?
Around the same time, an incredible stock price run was taking shape. A major discount retailer watched as its stock price soared more than tenfold from 1996 to 2000. It wasn’t Wal-Mart, Best Buy, or some other popular store. It was AMES Department Store, which was bankrupt by 2002.
On the contrary, Coca-Cola continues to generate Uniform return on assets (ROA) at some of the highest levels in the entire Valens database of 8,000 companies. The flagship cola product is still regularly heralded as the world’s top brand. Its venerable product distribution system may be called nearly unparalleled. As you read this, you are most likely less than 50 feet away from a place to purchase a Coke or one of its other products. So, what’s the problem with KO?
The Difference Between a Great Company and a Great Stock
How do we decipher the problem of business profitability levels and stock returns seeming so greatly out of sync?
Coca-Cola was a victim of its own great prior performance. At exactly mid-year 1998, Coca-Cola was trading at a record high of $88 per share, having achieved a record 40% Uniform ROA. But at that share price, what did the market expect Coca-Cola to continue to do? In other words, what levels of performance would KO need to achieve to create the cash flows necessary to maintain its all-time stock price high?
Using Valens Research database and the Uniform Accounting framework, KO’s stock price at the time reflected cash flow return levels that would essentially never, ever fall. It also embedded significant organic growth of more than twice U.S. GDP levels for decades.
The problem was not that KO had not achieved incredible performance. The problem was a question as to whether that performance was sustainable. Even if sustainable, where was the upside in owning the stock with that level of expectation already built into the price? There was really nowhere to go but down.
Eight years later we see the result of that unrealistic exuberance with a stock trading at half the price. This occurred not because the company isn’t a great one, but because the stock’s valuation simply wasn’t justifiable.
Great stock prices and great companies can accompany each other, but one needs to examine sufficiently long time periods. Over 20 years, KO is still outperforming the market by two or three times. That time period is marked with periods of unrealistic expectations; so, we see the stock price falling for eight years.
Ames Department Stores (Delisted as AMES Years Ago)
Around the same time that Coca-Cola’s stock price hit its spectacular highs, a different, yet incredible stock price run was taking shape. A major discount retailer watched as its stock price soared from 1996 to 2000. Through that period, its shares rose more than tenfold, and investors and management seemed as happy as can be.
The retailer in question was not Wal-Mart, Costco, Best Buy, or any of the like. The firm was Ames Department Stores. Unfortunately, the epilogue is described too sadly by a string of empty buildings and emptier parking lots in strip malls across the Northeastern United States. By 2001, the firm had already been seeking bankruptcy protection. How could company performance and company stock price send such different messages?
At AMES, investor forecasts simply exceeded reality. The original march upward from lows of $2 in 1996 to $30 and higher was not because the company was incredibly profitable. During the five-year period, AMES’ cash flow returns never once exceeded its cost of capital.
At $2, the stock was, for the most part, priced with the expectation that the firm would go into bankruptcy. However, AMES began avidly restructuring, divesting its least-performing assets. When a firm expected to go bankrupt doesn’t go bankrupt, its stock price rises, sometimes by leaps and bounds.
At the time, you had to scratch your head as an investor, watching a retailer divest assets, close stores, yet demonstrate stock returns that were better than those of Wal-Mart. But stock prices are what they are. As expectations go from low to high, the stock price goes up. Or in this case, as expectations went from “abysmal” to “potential survival,” the stock price ran from $2 to over $40 per share.
The closure on this case is interesting because it shows management’s folly in not understanding the real drivers of stock price. Somehow, the company saw a signal to grow its business and shifted its strategy to acquisitions and store openings in 1998 and 1999. The management team had previously shown discipline in shutting down problematic stores. By this time, it showed the folly of growing a business model that had not yet proven economically profitable. At no time did AMES’ cash flow returns appear to exceed even lower bars of opportunity costs.
By 2000, that folly had run its course. Growing a bad business is always a bad thing, no matter how well the stock price is doing. AMES’ death came relatively quickly, as the share price fell fast, and the chain finally closed for good in late 2002.
The Expectations Conundrum
With valuation levels based on expectations and not actual performance, there are troubling issues for investors and other decision-makers.
As a fundamentally based investor in 1998, would you short a stock that had risen for over 10 straight years? The market had priced in exuberant expectations; however, if expectations had reached that high level, maybe they could still go to ridiculously exuberant levels before the bottom fell out, so to speak. The entire internet bubble was a case study in this kind of market behavior.
As a board member, how do you align management’s interests with those of shareholders, when options and stock shares priced at such levels can only serve as reverse motivators? As a company manager, how do you have the faith to know whether or not you are “doing the right things” when the stock begins to fall precipitously despite profitability levels that remain the envy of the entire market?
Cash Flows Reveal the Truth
Many examples exist of companies that are often thought to be great companies simply because they are great stocks, and vice versa. IBM and Federal Express stand out as two companies that continually receive high marks in the financial press such as “most admired” status. A simple look at the firms’ cash flows, however, tells the tale: great turnarounds, not necessarily great companies. A series of other interesting examples are included at the back of this article.
Stock price alone can never reveal anything but changing expectations in a company’s performance levels; nothing about the quality of the performance itself.
Sharp investors live by what many novice investors fail to understand: that great companies can be terrible investments and vice versa. Therefore, great investments are made by better understanding the fundamentals behind the expectations. Those fundamentals need to be linked to long-term cash flow expectations, and only long-term forecasted cash flow analysis can explain the story that is built into any stock price.
The goal of corporate management remains the maximization of shareholder wealth, but that doesn’t guarantee premium shareholder returns. The market’s cash flow expectations set the bar that determines the company’s future stock price returns, regardless of the caliber of the management team. In the end, knowing the difference between a great company and a great stock is what differentiates great managers and investors from poor ones.
Appendix
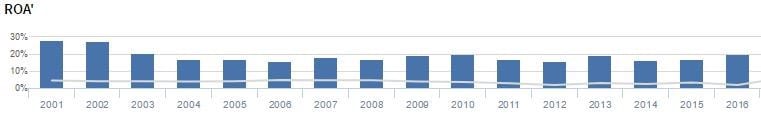
The Coca-Cola Company (KO:USA)
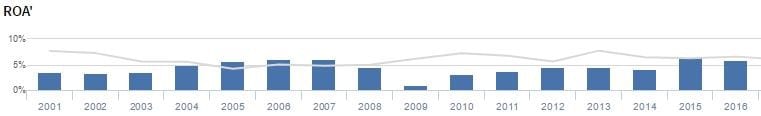
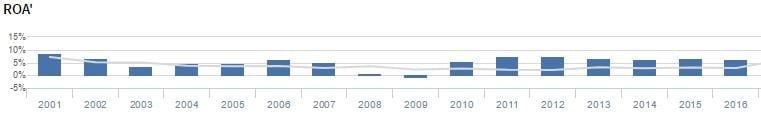
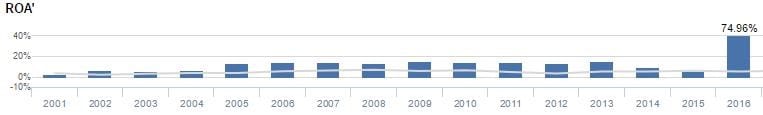
Uniform Return on Assets (ROA′)
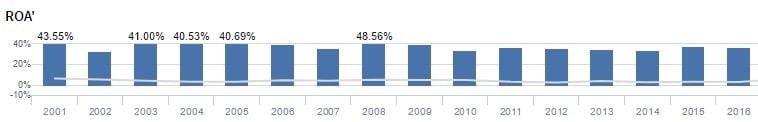
Uniform ROA Panel: KO’s ROA′peaked in 2008 at 49%. In recent years, returns for the company are still phenomenal, albeit lower than they were eight years ago.
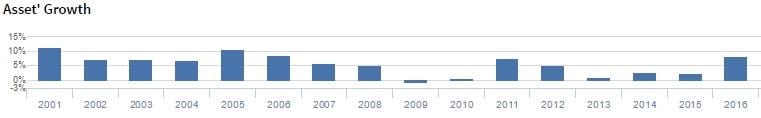
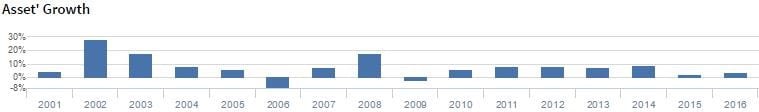
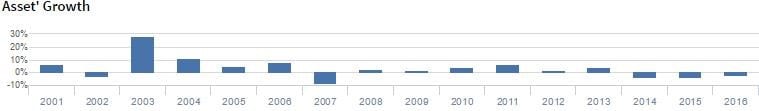
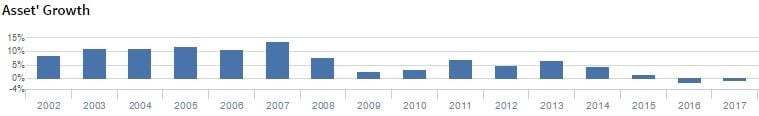
Uniform Asset Growth (Asset′ Growth)
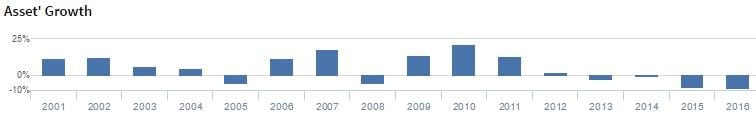
Uniform Asset Growth Panel: KO’s growth over the last several years has stemmed mainlythrough acquisitions. Unfortunately, that type of growth is not usually as valuable as organic growth.
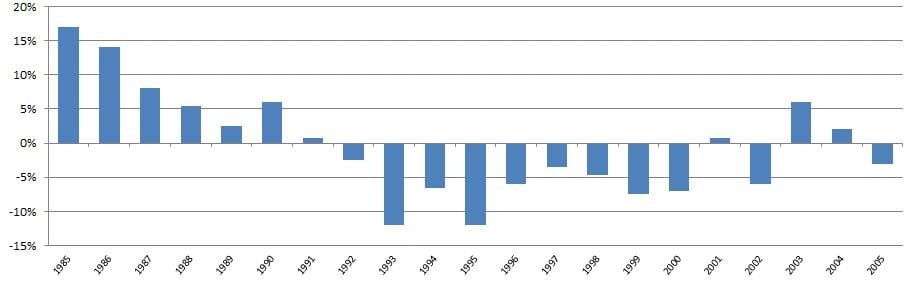
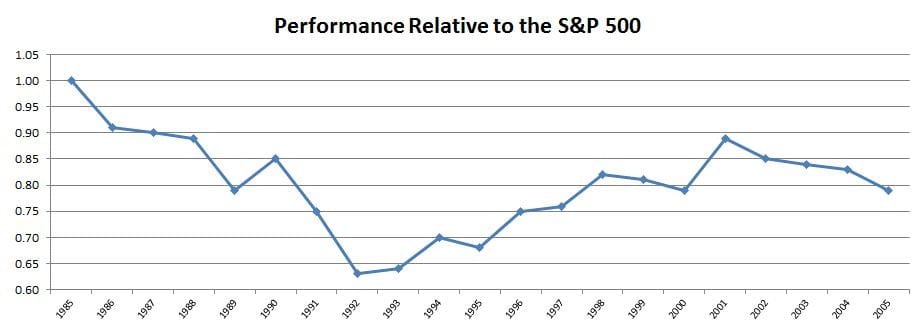
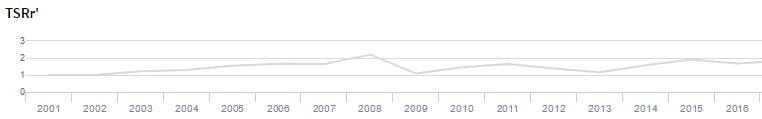
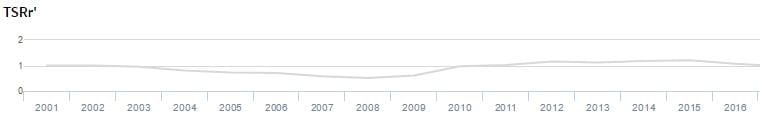
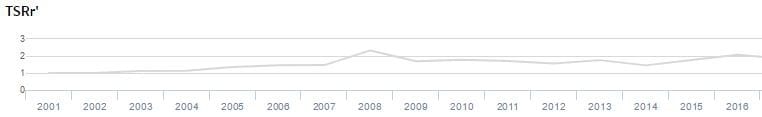
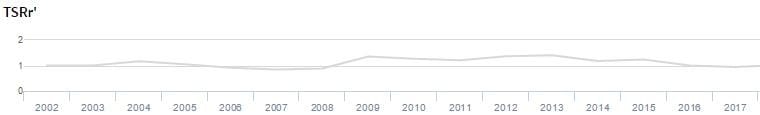
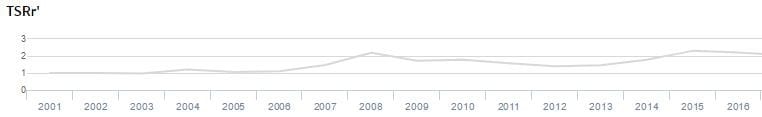
Performance Relative to the S&P 500
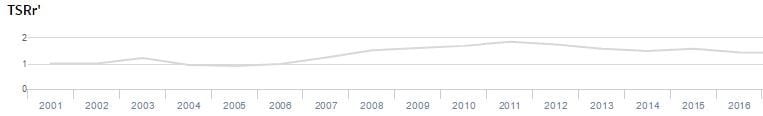
Relative Total Shareholder Return Panel: KO’s stock price performance relative to the market peaked in 2010 when returns hit decade-low levels following peak ROA′ in 2008. Though performance remained good, it was short of expectations, and stock price continued to fall. Still a great company, but not a great stock.
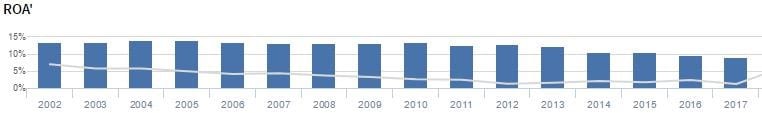
International Business Machines Corporation (IBM:USA)
Uniform Return on Assets (ROA′)
Uniform ROA Panel: The low ROA’s show how IBM was struggling to compete in the hardware market back to the late 80s. As it moved into services businesses, ROA’s dramatically improved.
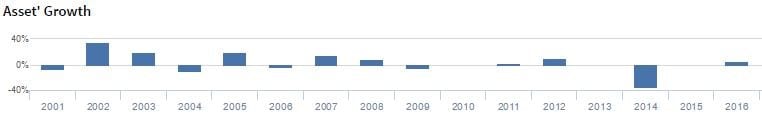
Uniform Asset Growth (Asset′ Growth)
Uniform Asset Growth Panel: To improve ROA’s, IBM divested low return businesses over more than a decade. However, as returns improved, new growth opportunities could not be found.
Relative Total Shareholder Return Panel: Rising and falling ROA’s drove a rising and falling stock price. Without growth to compound the value of recent returns, stock returns in the last decade have still not made up for losses in the 80s and 90s.
FedEx Corporation (FDX:USA)
Uniform Return on Assets (ROA′)
Uniform ROA Panel: FDX has never realized ROA’s at any comfort level above their cost of capital. While the company has a great product or service, it does not have a great business.
Uniform Asset Growth (Asset′ Growth)
Uniform Asset Growth Panel: FDX has a history of continually trying to grow a low ROA’ business. Only when ROA’s appear to have broken above the cost of capital has growth helped the stock price.
Performance Relative to the S&P 500
Relative Total Shareholder Return Panel: A clear example of the difference of a great company and a great stock. FDX’s stock returns have come from its ability to generate ROA’s above very low expectations set years ago, not from being a great business.
Bayerische Motoren Werke Aktiengesellschaft (BMW:DEU)
Uniform Return on Assets (ROA′)
Uniform ROA Panel: BMW generated below cost of capital levels prior to 2000 and during 2004-2010, despite a strong customer follow-up. Throughout the last few years a move from low to average returns marks a plateau shift in profitability levels.
Uniform Asset Growth (Asset′ Growth)
Uniform Asset Growth Panel: This shows a high reinvestment rate in the business. This has been quite consistent regardless of the cash flow returns over time.
Performance Relative to the S&P 500
Relative Total Shareholder Return Panel: Growth when ROA’s are not above cost of capital results in nothing for stock price. However, an ROA’ plateau shift in the last few years has driven great stock price returns.
Campbell Soup (CPB:USA)
Uniform Return on Assets (ROA′)
Uniform ROA Panel:CPB’s returns peaked in early 2000s, but declined since then. It still maintains good returns, though with profitability below 20% since the peak.
Uniform Asset Growth (Asset′ Growth)
Uniform Asset Growth Panel: Campbell Soup has not been able to grow organically for years. Growth and acquisition strategies in historical years may be the reason of falling ROA’s. Their divesting in recent years has slowly improved ROA’.
Performance Relative to the S&P 500
Relative Total Shareholder Return Panel: CPB showed a spike in stock price performance relative to the market on the years that they reduced their assets.
Wal-Mart Stores (WMT:USA)
Uniform Return on Assets (ROA′)
Uniform ROA Panel: This shows us the ability that Wal-Mart has in creating a great business. With great asset efficiency and reasonable margins, Wal-Mart has delivered high returns over an extended period of time.
Uniform Asset Growth (Asset′ Growth)
Uniform Asset Growth Panel: WMT’s Asset’ Growth decreased during the Great Recession beginning 2008. Historically, WMT has grown its assets by moving into new business areas to meet customer’s needs and expanding in many ways.
Performance Relative to the S&P 500
Relative Total Shareholder Return Panel: WMT’s stock price performance relative to the market picked up when they reduced their Asset’ base while still maintaining the same level of profitability.
Molson Coors Brewing Company (TAP:USA)
Uniform Return on Assets (ROA′)
Uniform ROA Panel: Prior to 2005, the chart is mainly the performance of Coors alone (formerly RKY) before the merger with Molson. For years, the company invested in bad business strategies. As major shift occurred when ROA’s begin rising above zero, and today even above its cost of capital
Uniform Asset Growth (Asset′ Growth)
Uniform Asset Growth Panel: High growth spikes mark mergers for the company. Otherwise growth has been minimal, though still problematic when it occurs with ROA’s below cost of capital
Performance Relative to the S&P 500
Relative Total Shareholder Return Panel: The market rewarded TAP for marching ROA’s toward average levels in 2007. It has maintained good returns since then.