UAFRS Research – Excess Cash Findings: Any cash above 1x Un-Incurred OpEx, 2x R&D Spend, and 5% of Revenue is Non- Operating
Excess Cash Findings: Any cash above 1x Un-Incurred
OpEx, 2x R&D Spend, and 5% of Revenue is Non-
Operating
Corporations inherently need some level of cash to operate their
business, without which they would have liquidity issues and
customers and suppliers would be hesitant to build long-term
relationships with them. However, companies with substantial cash
balances (above what one might view as “operating” cash) can see
as-reported ROA diluted because of the substantial portion of the
balance sheet that ends up being taken up by cash that is earning
limited or no return, especially in the current environment. As such,
if excess cash is not removed from the asset base of a company
before looking at performance metrics, a company can appear to
have substantially lower operating profitability (in terms of ROA)
than it actually has.
Uniform Accounting research has found three key methods for
computing excess cash, focusing on R&D expense, revenue, and un-
incurred OpEx. This is based on analyzing over 25,000 individual
corporate datapoints over a 10 year period, identifying key
thresholds for levels of cash companies keep on the balance sheet,
which was also backed up by empirical research. The final
conclusions of the research showed the following thresholds:
R&D Expense – 2x annual spend
Companies with heavy R&D investment that fuels their innovation
and growth tend to keep roughly two times their R&D investment in
cash on the balance sheet. This is meant to give them visibility, and
give their customers confidence in their sustainability.
Revenue – 5% current annual revenue
In general, companies need some operating cash on their balance
sheet to handle regular operating costs of doing business, and give
suppliers confidence in their liquidity.
Unearned OpEx – 1x operating costs related to unearned revenue
Companies that have significant unearned revenue that they have
already been compensated for seek to guarantee they can deliver on
that revenue by maintaining cash buffers in-line with costs they are
already committed to.
Empirical analysis and logic lines up with the UAFRS fundamental research on the reason for different thresholds for excess cash.
R&D Expense
Developing an innovative product usually requires an intensive and constant stream of capital allocation on R&D. Most U.S. companies, particularly tech companies who heavily invested in R&D, tend to have a sizable amount of cash on their balance sheet relative to their expenses to maintain their R&D (software and hardware). Research shows the average threshold multiple between cash on the balance sheet and R&D expense is two years. This implies that even if the company has no revenue stream for two years, they can operate and support their product development.
This lines up with empirical data that we have researched previously. A while back, we did a tour at Silicon Valley and met with a number of tech management teams and seasoned buy-side and sell-side analysts covering those companies. When polling some of the tech giants involved in big buybacks, we were inquiring as to just how much cash could possibly be “bought back.” the upper limit of that could be considered “excess.”
Interesting to note that fairly large cash balances were considered “operating” for firms like Microsoft (MSFT), Oracle (ORCL), and others. The reason was not for an M&A war chest, as often heard. It appeared unequivocally as an R&D war chest.
Interesting to note that fairly large cash balances were considered “operating” for firms like Microsoft (MSFT), Oracle (ORCL), and others. The reason was not for an M&A war chest, as often heard. It appeared unequivocally as an R&D war chest.
A head of sales of one of the large B2B tech firms said the following. “If I can’t show our customers that we have enough cash to fund us through the next cycle of our software, what faith would they have in installing a major system.” He followed with saying, “How else can I show that than with 3 to 5 times annual R&D sitting on our books at any given time? That’s the only way to show we can stay with them through the next cycle.“
Revenue + Current and Long-term Unincurred OpEx
Research also shows that generally, companies retain cash on their balance sheet equivalent to 5% of their total revenue. Retaining 5% of their total revenue is roughly equivalent of retaining one month of revenue. This inherently implies that the company has enough liquidity to handle or pay their operating cost for a month.
But if the company has current and long-term unearned revenue, the excess cash computation under revenue method needs to account for the current and long-term unearned revenue the company has. The company is likely to incur expenses related to this unearned revenue. The company has already been paid for these expenses, meaning they are not likely to receive any more compensation to offset the pending costs. As such, unless the company wants to risk having a liquidity crunch and not being able to service their obligations, they tend to hold onto sufficient cash to service those future commitments.
Universe Analyzed
We looked at 2,890 companies for 10 years, for a total of 28,900 individual datapoints for each subset.
Focus Of Analysis
For our initial analysis, we were focusing in on understanding “Operating Cash” (cash a company generally needs to have on its balance sheet, cash that doesn’t qualify as excess cash) based on revenue, R&D and also based on “Un-incurred Operating Expense”, which is what we calculate the operating expenses for a company to be for unearned revenue currently sitting on the balance sheet.
Process of Analysis
We looked at the data from a few perspectives:
˗ We calculated some standard statistics across the entire universe and individual industry groups (min/max/mean/median/mode/std deviation)
˗ We calculated what level of the different metrics (R&D, revenue, unincurred OpEx) would “cover” 2 standard deviations of variance, 68% of the universe, what would cover 90% of companies falling within the excess cash limits, cover 95% companies falling within the excess cash limits, or cover 99% of the companies falling within the excess cash limits
˗ Lastly, we looked at the thresholds we would expect to matter, and where they fall in terms of what percentile that reaches
The tables in the back of the report have the data from this analysis.
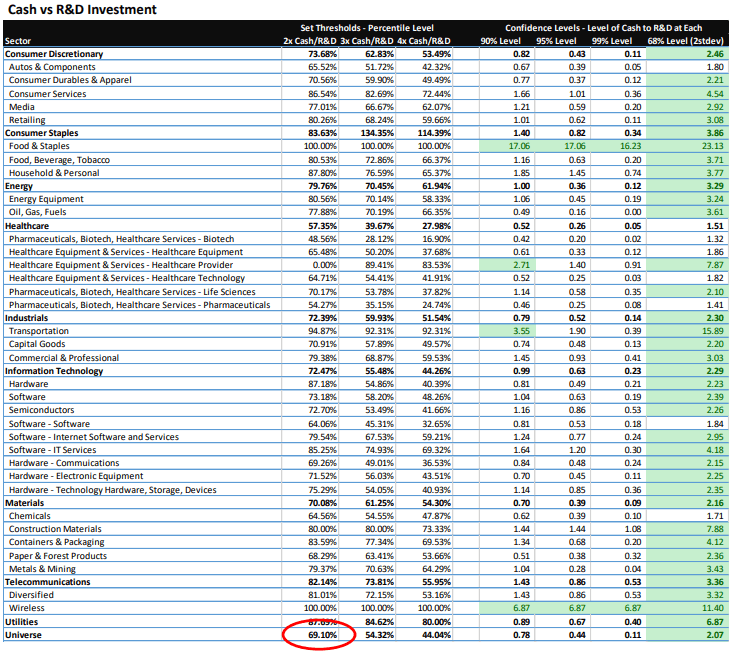
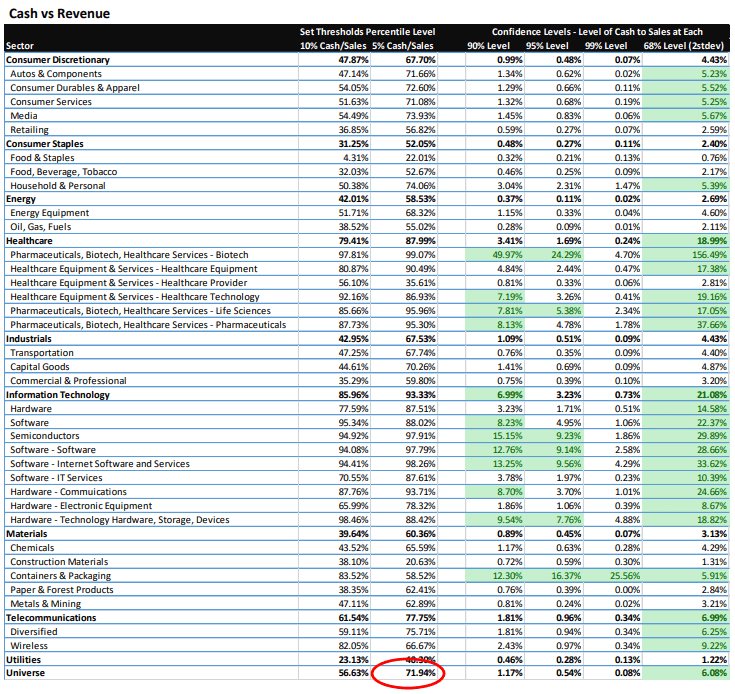
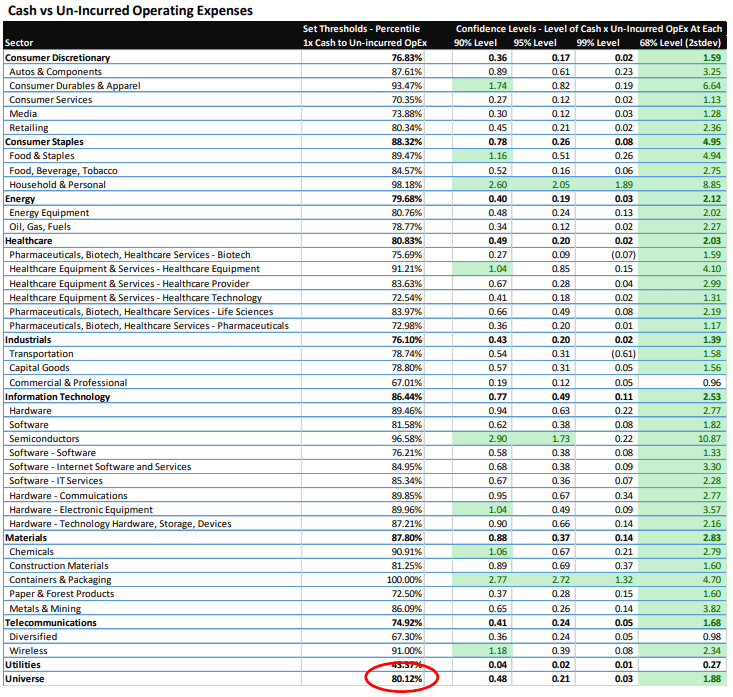
For Cash to Sales, it was expected that 5% or 10% would be important threshold. The first columns highlight what % of companies operate with cash on hand higher than that threshold. Similarly for 2x, 3x and 4x R&D, and again for a threshold of 1x Cash to Unincurred Opex.
We performed this analysis for the entire universe, and then we also looked closer at the individual sectors and industry groups. For the R&D intensive Healthcare and Technology sectors, we drilled down to the industry levels.
Conclusions
In the spreadsheet, the green highlighted (with green text) boxes specify industry thresholds that appear important for each type of operating cash analysis:
– 1x Cash to Un-incurred Operating Expenses
– 2x Cash to R&D Expense
– 5% of Sales in Cash>
Consistently high thresholds lined up with the 2 standard deviations (68% of the dataset) across these thresholds above.
Key statistics, across the universe:
Well in excess of 68% of companies keep more than 1x calculated un-incurred operating expenses on the balance sheet in cash – 80% of companies. 68% of companies keep nearly 2 times (1.88x) un-incurred operating expenses on the balance sheet in cash.
69% of companies, just above the 2 standard deviation threshold, keep over 2x their R&D in cash on the balance sheet.
72% of companies, also above the 2 standard deviation threshold, keep over 5% of sales in cash on the balance sheet
Other insights that came from the analysis, when drilling down into more detail of the individual sectors:
No individual industry was substantially below the 2 standard deviation threshold for 1x Cash to Un-incurred Opex. The 2 industries that were below this threshold (Commercial & Profession Services for Industrials and Diversified Telecom companies) were still at 0.96x and 0.98x respectively at the 68% percentile threshold
For Cash to R&D, many of the most R&D intensive industries were industries where cash relative to R&D thresholds were the lowest, including Autos, Biotech, Pharma, Healthcare Equipment, Healthcare Technology , Software and Chemicals. These companies ranged between 1.3-1.8x R&D being held in cash on hand.
Unsurprisingly, because of the other important thresholds for operating cash for these sectors (R&D for both Healthcare and Technology and Unincurred Operating Expenses for Technology), both the Healthcare and the Technology sectors had cash as a percentage of sales thresholds well in excess of 5 or 10%. 68% of those firms had cash as a % of sales of around 20%.