
Corporate credit is not the only KPI for economic growth, looking at this important metric can show if concern is warranted for the economy

It isn’t just corporate credit cycles that power economic and market cycles, it’s the entire credit market. It is important to follow both the consumer and corporate credit signals.
In the current environment, two important indicators are showing positive signs in the consumer credit markets, which could foreshadow optimism in the economy as a whole.
Today, we will investigate the data and discuss what it says about the health of consumer credit markets.
Investor Essentials Daily:
The Monday Macro Report
Powered by Valens Research
When covering corporate credit, we regularly discuss the importance of looking past just debt levels. It is necessary to look at companies’ ability to pay off the debt in relation to when this debt will come due. A company with little debt but even less cash can be at a greater risk than a firm with high debt levels and robust cash flows and cash on hand.
Corporations have taken on more credit over the past forty years. This is because interest rates have trended steadily downward, from above 20% in the 1980s to sub 3% levels in recent years. Also, as we have discussed previously, these companies are able to manage the debt.
Because of this, even though some industries have seen pressure and bankruptcies since the beginning of the pandemic, as a whole, corporations haven’t struggled. The lack of broader credit issues has helped the economy immensely. This has prevented the economic slowdown from the coronavirus from becoming a deeper and longer recession into 2021 and beyond.
While understanding the risk of corporate credit default is a key part of macroeconomic analysis, focusing on consumer credit is also crucial. Consumer credit can affect the economy just as much as corporate credit, as mass consumer bankruptcies will grind the economy to a halt.
This concern is only exacerbated with climbing unemployment. Currently, the unemployment rate is hovering around 10%, and has the potential to deteriorate further. With talks of unemployment benefits and eviction protections expiring, some economists fear mass personal bankruptcies could follow.
To keep a pulse on the consumer, there are two charts we can look at for signals of the risk of mass defaults. The first chart is household debt service payments as a percentage of disposable income. This ratio tells us how much each household must spend to pay off any outstanding debt.
The chart has fluctuated between 10% and 13% over the previous four decades. During the previous two recessions, it reached short-term peaks. In these instances, households took on too much debt, which had adverse consequences on the economy as a whole.
The current state of household debt service payments as a percentage of disposable income shows much different, positive signals. It is currently at its lowest levels since at least 1982.
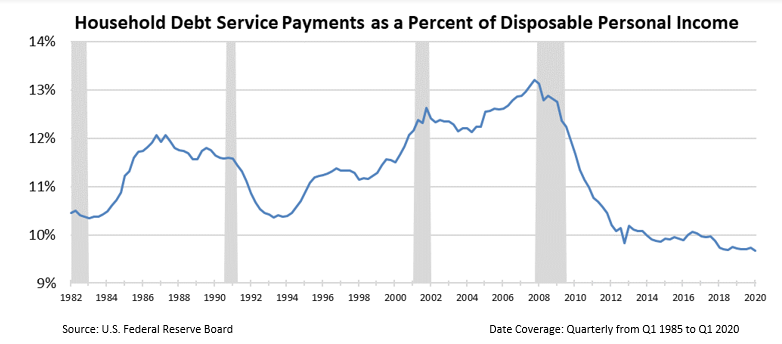
This shows there is flexibility for US consumers to service their debt obligations. This also points to a safety valve of available credit going forward.
The second indicator we can look at is the different kinds of consumer credit delinquency rates. This data comes directly from the New York Federal Reserve, and it fills in the nuances of the current debt Americans are struggling with.
From the graph, it is clear to see student delinquency rates are elevated. However, student loan debt has also been at this elevated level for nearly a decade. There isn’t a new warning signal from the recession, or trigger to the recession getting worse.
We can also see from the below chart that credit card and auto loan delinquencies are rising. However, they are rising from relatively low levels. Also, auto and credit card debt only make up roughly 15% of outstanding household debt.
The final take away from the data relates to mortgage debt, which makes up roughly 68% of household debt. Mortgage debt has been steadily falling since the housing bubble over a decade ago and is currently nearing all-time lows. This is very positive and also important for all the other debt drivers.

With only two of the six major types of household debt rising, there is no glaring fear of a collapse in the consumer credit markets. Overall, delinquency rates were significantly higher in 2009 and 2010 during the last recession. Furthermore, in 2007, every type of consumer credit was rising, while what we see now is much less ominous.
The two previous charts show that consumer credit markets were largely healthy when the coronavirus pandemic began. This helps give confidence the pandemic’s adverse effects may not be as strong as some fear.
It is hard to look past the noise of consistently negative news headlines. Record unemployment numbers and rising debt levels are painful, and these rightfully scare investors. However, it is necessary to look past the noise and discover consumers on aggregate have further headroom to service their debts. As such, the fundamentals are showing that there are no impending consumer credit problems.
Best regards,
Joel Litman & Rob Spivey
Chief Investment Strategist &
Director of Research
at Valens Research