
This hedge fund manager invests like a Rothschild, and Uniform Accounting hints he too knows something ahead of the crowd

This informational advantage-based investor follows in the footsteps of other investing greats and one of the greatest banking dynasties ever. They were always focusing on being one step ahead of the market.
Uniform Accounting metrics highlight he is investing like he knows something that everyone else doesn’t. He invests in high quality companies while betting their growth will significantly exceed current analyst forecasts.
It’s almost as if he and his team have information on growth that Wall Street isn’t aware of yet.
In addition to examining the portfolio, we’re including a deeper look into the fund’s largest current holding, providing you with the current Uniform Accounting Performance and Valuation Tearsheet for that company.
Investor Essentials Daily:
Friday Uniform Portfolio Analytics
Powered by Valens Research
The Rothschilds are legendary in the world of banking. Mayer Rothschild’s children built one of the first—if not the first—true international banking organizations. He sent his five sons to capitals across Europe to set up local banking operations, to tremendous success.
The Rothschilds’ pan-European footprint was extremely valuable when it came to knowing what was going on across the continent. Their diverse exposure, lending to various governments and companies, with sometimes conflicting exposures and interests, made it essential that they have agents across Europe gathering data on what was occuring.
The Rothschilds’ syndicate of agents at the banks, including Nathan Mayer Rothschild’s London operation, sometimes received information well before the market as a whole got the same data.
A story that has since been shown to be apocryphal illustrates the potential power of this informational advantage.
It was said that Nathan learned that the Duke of Wellington and the Seventh Coalition had defeated Napoleon and the French army at the Battle of Waterloo, well before the rest of London.
This was hugely important to the outlook for the entire continent. Napoleon’s wars had ravaged Europe and his return after exile was at risk of throwing Europe into chaos again.
According to the story, using this information, Rothschild was able to speculate on British government bonds. He sold them to create panic, then scooped up the bonds at a deep discount before the news arrived at the city that Wellington had won Waterloo.
While the story isn’t true, it highlights how knowing something about the market before the rest of the market reacts to it is powerful. Having legal informational advantage is a way to significantly increase the odds you’ll make money in the market.
Because of that power, investors have been attempting to gain this type of advantage since investing began. In the modern era, this has created the likes of expert networks, management meetings, satellite firms selling data, tracking of planes criss-crossing executives across the US closing deals, and the like.
One of the investors and firms most synonymous with the goal of getting that incremental piece of data—the information advantage—is Steven A. Cohen and Point72, previously S.A.C. Capital before it was converted to a family office, and then reopened as a hedge fund again.
We’ve reviewed several different types of investors over the past several months.
We’ve reviewed value investors like Buffett, Klarman, and Eveillard. We’ve also reviewed growth investors like Driehaus.
We’ve reviewed credit investors like Mitch Julis. We’ve even reviewed quant investing firms like Bridgewater and thematic investors like the Tiger cubs.
Steve Cohen and Point72 pursue a very different strategy.
The firm’s strategy is much more focused on trading. They are focused on uncovering marginal incremental data points to be ahead of the overall market in investing.
In a perfect world, Point72 wants to be Rothschild before the news of Wellington’s victory arrives in London. This meant their portfolio should be positioned for what is going to be discovered, for them to gain the maximum benefit.
Sometimes, that means Point72 might have a window into a stock that the market and analysts don’t even have. But even when that’s the case, they aren’t trying to buy companies that are years from turning around. Often, they’re investing in high quality companies where they don’t also have to worry about being surprised.
We’ve conducted a portfolio audit of Point72’s top holdings based on their most recent 13-F.
We’re showing a summarized and abbreviated analysis of how we work with institutional investors to analyze their portfolios.
Interestingly, while Point72 is clearly investing in high quality companies, which as-reported metrics don’t show, but Uniform Accounting metrics do, there also is another interesting pattern for Point72’s ideas.
The average Point72 idea has higher market expectations for earnings growth than analysts are forecasting. And yet, Point72 still owns these names.
Perhaps this is a sign that Point72 has some informational advantage that the market does not. Perhaps Point72 knows that the market hasn’t even fully priced in reality. Perhaps Point72 also knows that as soon as analysts realize the larger earnings growth potential for these companies, the market will too.
Point72’s strategy lines up with the data, once you use Uniform Accounting.
See for yourself below.
Using as-reported accounting, investors might think Point72’s idea of being ahead of the game is to buy poor-performing companies before they turnaround.
It would be a much longer “trade” but it is understandable why investors would misunderstand that.
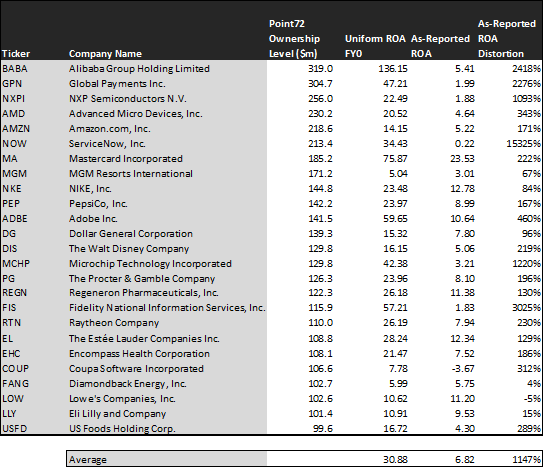
The average company in the portfolio displays an impressive average Uniform return on assets (ROA) at 31%. That’s well above corporate average returns currently. On an as-reported basis, many of these companies are poor performers with returns below 6%, and the average as-reported ROA is only 7%.
We make Uniform Accounting (UAFRS) adjustments to accurately calculate earning power of each firm. We can see that the returns of the companies in Point72’s portfolio are much more robust.
Once the distortions from as-reported accounting are removed, we can realize that Alibaba (BABA) doesn’t have a 5% ROA, it is actually at 136%. Alibaba is a world-beating company that is both growing and producing impressive profitability for shareholders.
Similarly, Global Payments (GPN) ROA is really 47%, not 2%. While fundamental investors are overly punishing the company for a potential poor acquisition strategy, Point72 recognizes its strong earning power.
ServiceNow (NOW) is another great example of as-reported metrics mis-representing the company’s profitability.
If Point72 was looking at as-reported numbers, they’d think they were investing in a company that wasn’t earnings positive yet. The reality is that they were buying a strongly positive software and services machine.
ServiceNow doesn’t have a 0% ROA, it is actually at 34%. Point72’s analysts are identifying a strongly returning company that has good visibility they can benefit from.
The list goes on from there, for names ranging from Mastercard (MA) and Microchip Technology (MCHP), to Fidelity National Information Services (FIS), Adobe (ADBE), and NXP Semiconductors (NXPI).
If Point72 was analyzing as-reported metrics, it might look like they never spent time analyzing these companies more deeply, because they look like bad companies and poor investments.
But to find companies where Point72’s analysts can isolate a few specific issues, you need companies that have more visibility, that are one-issue companies.
Point72 appears to be investing in those types of companies, once you see through the noise using Uniform Accounting.
But to find companies that can deliver alpha beyond the market under Point72’s strategy, just finding companies where as-reported metrics misrepresent a company’s real profitability is insufficient.
To really generate alpha, Point72 has to find information others don’t know yet, including the Wall Street analysts.
Uniform Accounting highlights Point72 might be doing this correctly also.
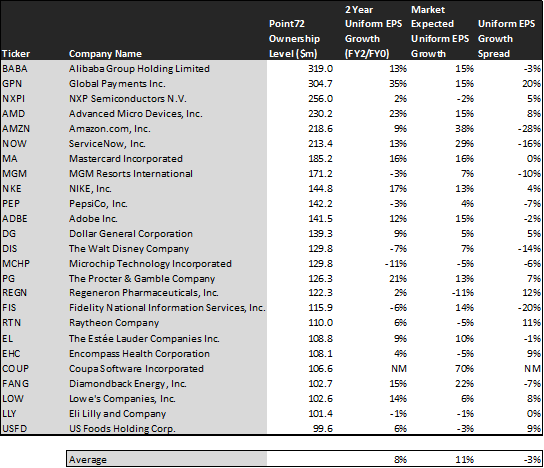
This chart shows three interesting data points:
– The first datapoint is what uniform earnings growth is forecast to be over the next two years, when we take consensus Wall Street estimates and we convert them to the Uniform Accounting framework. This represents the uniform earnings growth the company is likely to have in the next two years
– The second datapoint is what the market thinks uniform earnings growth is going to be for the next two years. Here, we are showing how much the company needs to grow uniform earnings by in the next 2 years to justify the current stock price of the company. If you’ve been reading our daily and our reports for a while, you’ll be familiar with the term embedded expectations. This is the market’s embedded expectations for uniform earnings growth
– The final datapoint is the spread between how much the company’s uniform earnings could grow if the Uniform Accounting adjusted earnings estimates are right, and what the market expects uniform earnings growth to be
The average company in the US is forecast to have 5% annual Uniform Accounting earnings growth over the next 2 years. Point72’s holdings are forecast by analysts to outpace that, growing at a healthy 8% a year the next 2 years, on average.
But Point72 isn’t just trying to find strong return, higher growth companies. It wants to find companies that have those characteristics, which might help them outperform the market, while also having reasons to believe that those stocks will surprise to the upside.
Normally, when we analyze this table, we want to find companies where the companies are growing, but the market expects them to grow less than Wall Street analysts forecast. That’s not the case here, and that might be intentional.
On average, the market is pricing these companies to grow earnings by 11% a year, 3% more than analysts forecast. While these companies are growing healthily, they actually need to grow faster than analysts are forecasting, just to be fairly valued.
The market either has expectations that are too high, or analysts are being too pessimistic.
Point72 may be finding information that makes them think the latter is the case, and its analysts may think the companies can grow even more than the market currently expects.
If Point72 is right, when analysts have to raise their estimates for companies, the market will react, and the stocks will rise higher. Point72 will already be positioned to benefit.
One example of a company Point72 appears to be betting on analysts needing to raise estimates for is Amazon (AMZN). Amazon’s analyst forecasts have 9% Uniform earnings growth built in, but the market is pricing the company to have earnings rise by 38% earnings each year for the next two years.
By the way, Amazon just crushed earnings estimates yesterday. The stock is up over 10% and once its stock opens today, it will be a trillion dollar company.
Another company with similar dislocations is Walt Disney (DIS). Expectations may look modest with market expectations for a 7% growth in earnings. However the company is actually forecast for Uniform EPS to shrink by 7% a year.
The company will need to surprise on the upside to not disappoint the market, and analysts will need to raise estimates for the stock to go higher. That appears to be what Point72 is anticipating.
Yet another is the fund’s largest holding, MGM Resorts (MGM), which is priced for a 7% rise in Uniform earnings, but analysts forecast that its earnings will shrink by 3% a year.
That being said, some of Point72’s investments are mispriced in a more traditional way, where analyst expectations are higher than market expectations. These companies are intrinsically undervalued, not just catalysts stocks waiting for a bump.
Regeneron Pharma (REGN) is forecast to see Uniform earnings rise by 2% a year going forward. However, the market is pricing the company for 11% annual earnings shrinkage.
But for the most part, Point72’s strategy appears to be to invest in high quality, higher growth companies that have the potential to beat and raise.
It wouldn’t be clear under GAAP, but unsurprisingly Uniform Accounting shines a clear light on the fund’s strategy.
Alibaba Group Holding Limited Tearsheet
As Point72’s largest individual stock holding, we’re highlighting Alibaba Group Holding’s tearsheet today.
As our Uniform Accounting tearsheet for Alibaba Group Holding highlights (BABA), Alibaba Group Holding’s Uniform P/E trades at 25x, above corporate average valuation levels and its own history.
High P/Es require high EPS growth to sustain them. In the case of Alibaba, the company has recently had strong 30% Uniform EPS growth.
While Wall Street stock recommendations and valuations poorly track reality, Wall Street analysts have a strong grasp on near-term financial forecasts like revenue and earnings.
As such, we use Wall Street GAAP earnings estimates as a starting point for our Uniform Earnings forecasts. When we do this, we can see that Alibaba is forecast to see Uniform EPS growth of 42% in 2020 followed by 11% shrinkage in 2021.
Based on current stock market valuations, we can back into the required earnings growth rate that would justify $205 per share. These are often referred to as market embedded expectations. In order to meet the current market valuation levels of Alibaba Group Holding Limited, the company would have to have Uniform earnings grow by 15% each year over the next three years.
What Wall Street analysts expect for Alibaba’s earnings growth is far above than what the current stock market valuation requires.
To conclude, Alibaba Group Holding Limited’s Uniform earnings growth is in line with peer averages in 2020. Also, the company is trading above average peer valuations.
The company’s earnings power is 23x corporate averages, signaling that there is very low cash flow risk to the company’s operations and credit profile in the future.
Best regards,
Joel Litman & Rob Spivey
Chief Investment Strategist &
Director of Research
at Valens Research