
This investor’s strategy is built off of the philosophy that “there’s nothing new on Wall Street” and Uniform Accounting shows he’s getting it right

This hedge fund titan follows in the footsteps of one of the greatest traders of all time. He’s internalized his rules, and even sounds like him, having written the forward to his idol’s book.
Using GAAP as-reported financial metrics, the investments in his fund’s portfolio look like he’s misunderstanding his idol’s strategy.
In reality, UAFRS-based financial metrics helps make sense of the stocks he is buying, and how they line up perfectly.
In addition to examining the portfolio, we’re including a deeper look into the fund’s largest current holding, providing you with the current Uniform Accounting Performance and Valuation Tearsheet for that company.
Investor Essentials Daily:
Friday Uniform Portfolio Analytics
Powered by Valens Research
The Panic of 1907 and crash of 1929 and the Great Depression were named as such because they caused significant pain and panic in both the economy and the market.
Many people lost their entire savings. From early September 1929 until the end of that year alone, over $40 billion of market value was lost on the NYSE, equivalent to $600 billion in current dollars.
The average, and even the greatest, investors struggled to make any money in that market. But there’s one famous stock trading great who made millions in both of those pullbacks.
He was able to because he believed in one key saying:
“There is nothing new on Wall Street. There can’t be, because whatever happens has happened before, and will happen again.”
Jesse Livermore made $100 million shorting the market in 1929, equivalent to $1.4 billion today. He was paying attention to patterns he had identified over decades of trading.
He understood that human behavior would lead cycles to repeat over and over again. You just needed to know where to look to identify them.
One of Livermore’s biggest areas of focus was around credit. His knowledge of how credit cycles impacted equity market and economic cycles fueled his overall strategy for investing. He focused on price patterns over shorter-term periods to position his portfolio.
Livermore’s strategy, successes, and philosophy are captured in the must-read for any stock trader, Reminiscences of a Stock Operator, which was written in 1923.
The book is so well respected by traders that one of the great modern traders, Paul Tudor Jones, wrote the foreword of the 2010 edition.
Tudor is a student of Livermore’s trading philosophy, so it is unsurprising that many of his quotes sound like they could have been spoken by Livermore himself.
Tudor has often highlighted that he makes his money at inflections, not in the middle of cycles, identifying big swings he can profit from significantly. This is as much as Livermore did in 1907 and in 1929.
Tudor has talked about how leverage causes market crashes, and how bubbles will perpetually repeat themselves. This almost sounds like parroting back Livermore’s view on there being nothing new on Wall Street, and his focus on understanding credit cycles to identify market cycles.
At Tudor Investments, the focus is on trading, and looking for those inflections. As Paul Tudor Jones has said:
“I believe the very best money is made at the market turns. Everyone says you get killed trying to pick tops and bottoms and you make all your money by playing the trend in the middle. Well, for twelve years I have been missing the meat in the middle but I have made a lot of money at tops and bottoms.”
When looking at the duration Tudor Investments has held most of its largest positions, it’s unsurprising that it is often for 2-3 quarters at max. Excluding ETFs, 8 of the firm’s top 10 positions have been in its portfolio for less than 2 quarters.
Only one has been held for most of the past 2+ years, CME Group (CME).
Tudor is a different type of investor from the others we’ve reviewed over the past few months. He’s not a long-term buy and hold investor like a Baupost or a First Eagle, or a quant investor like Bridgewater or Renaissance. Even Point72, another trading firm, tends to hold for longer-term fundamental signals, as opposed to Tudor’s short-term trades.
That being said, analyzing Tudor’s portfolio can still identify some insights about the type of companies Tudor will trade.
We’ve conducted a portfolio audit of Tudor’s top holdings, based on their most recent 13-F, excluding ETF holdings.
We’re showing a summarized and abbreviated analysis of how we work with institutional investors to analyze their portfolios.
Unsurprisingly, while Tudor is focused on trading, the companies the firm focuses on appear to not be uncertain poor performing names, like as-reported metrics reflect. In reality they appear to be higher quality names, once Uniform Accounting metrics are reviewed.
This likely makes it easier for Tudor to focus on the one issue that matters for these companies.
See for yourself below.

Using as-reported accounting, investors would think Tudor is buying distressed names and waiting for the inflection, based on Paul Tudor Jones’ quote on making money on the inflections.
On an as-reported basis, many of these companies are poor performers with returns below 5%, and the average as-reported return on assets (ROA) is only 4%.
In reality, the average company in the portfolio displays an impressive average Uniform ROA at 16%. That’s above corporate average returns currently.
Once we make Uniform Accounting (UAFRS) adjustments to accurately calculate earning power, we can see that the returns of the companies in Tudor’s portfolio are much more robust.
Once the distortions from as-reported accounting are removed, we can realize that Allergan (AGN) doesn’t have a 1% ROA, it is actually at 35%. Allergan is a strongly profitable pharma company and the combined Allergan/AbbVie post-merger company will have high returns.
Similarly, Caesar’s’ (CZR) ROA is really 12%, not 3%. While as-reported metrics are overly punishing the company for accounting noise related to its bankruptcy and PE backing, Uniform Accounting sees its strong profitability and visibility of earning power.
CME Group (CME), one of Tudor’s rare long-term positions, is another great example of as-reported metrics mis-representing the company’s profitability.
CME doesn’t have a 2% ROA, it is actually at 80%. Tudor appears to understand that market expectations for the company, thinking its a low return business, is completely incorrect.
The list goes on from there, for names ranging from RIngCentral (RNG) and Disney (DIS), to Constellation Brands (STZ), Northrop Grumman (NOC), and Cognizant (CTSH).
If Tudor was focused as-reported metrics, it would never pick most of these companies because they look like bad companies and poor investments to predict inflections for.
But to find companies that can deliver alpha beyond the market, just finding companies where as-reported metrics mis-represent a company’s real profitability is insufficient. `
To really generate alpha, any investor also needs to identify where the market is significantly undervaluing the company’s potential.
Tudor is also investing in companies that the market has low expectations for, low expectations the companies can exceed.
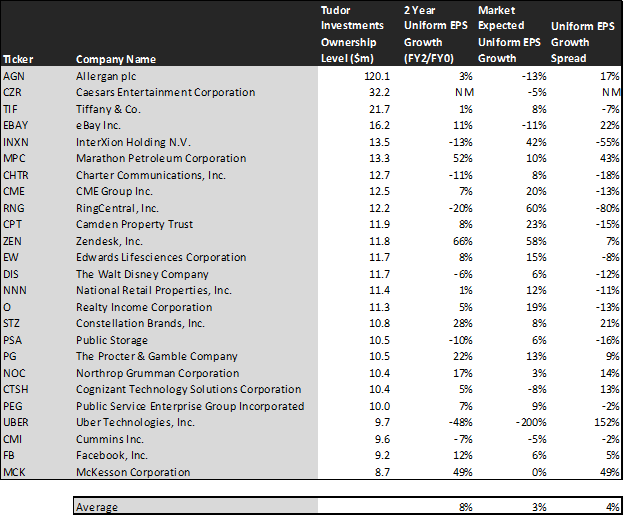
This chart shows three interesting data points:
- The 2-year Uniform EPS growth represents what Uniform earnings growth is forecast to be over the next two years. The EPS number used is the value of when we take consensus Wall Street estimates and we convert them to the Uniform Accounting framework.
- The market expected Uniform EPS growth is what the market thinks Uniform earnings growth is going to be for the next two years. Here, we show by how much the company needs to grow Uniform earnings in the next 2 years to justify the current stock price of the company. If you’ve been reading our daily and our reports for a while, you’ll be familiar with the term embedded expectations. This is the market’s embedded expectations for uniform earnings growth.
- The Uniform EPS growth spread is the spread between how much the company’s Uniform earnings could grow if the Uniform earnings estimates are right, and what the market expects Uniform earnings growth to be.
The average company in the US is forecast to have 5% annual Uniform Accounting earnings growth over the next 2 years. Tudor’s holdings are forecast by analysts to outpace that, growing at a robust 8% a year the next 2 years, on average.
Tudor is not just finding high quality, higher growth companies though, it is finding mispriced companies.
On average, the market is pricing these companies to only grow earnings by 3% a year. While these companies are growing robustly, they are intrinsically undervalued, as the market is mispricing their growth by 4%-5% on average.
These are the kinds of companies that are likely to see their stocks rally when the market realizes how wrong it is. Without Uniform numbers, the GAAP numbers would leave everyone confused.
One example of a company in the Tudor portfolio that has growth potential that the market is mispricing is eBay (EBAY). eBay’s Wall Street analyst forecasts have 11% Uniform earnings growth built in, but the market is pricing the company to have earnings shrink by 11% each year for the next two years.
Another company with similar dislocations is Procter & Gamble (PG). Expectations may look high with market expectations for a 13% growth in earnings. However the company is actually forecast for Uniform EPS to grow by 22% a year. While expectations are high, if it can deliver higher growth, there’s more upside.
Yet another is the fund’s largest holding, Marathon Petroleum (MPC), is priced for a 10% growth in Uniform earnings, when the company is forecast to grow by earnings by 52% a year.
That being said, there are a few companies we’d recommend Tudor look at again before holding.
InterXion (INXN) is forecast to see Uniform earnings shrink by 13% a year going forward, however the market is pricing the company for 42% annual earnings growth.
This doesn’t look like an intrinsically undervalued company. If anything, the market looks significantly too bullish.
But many of Tudor’s holdings look like a high quality, undervalued set of stocks with businesses displaying strong earning power. It wouldn’t be clear under GAAP, but unsurprisingly Uniform Accounting sees the same signals that Tudor appears to.
Allergan plc Limited Tearsheet
As Tudor Investment’s largest individual stock holding, we’re highlighting Allergan’s tearsheet today.
As our Uniform Accounting tearsheet for Allergan plc (AGN) highlights, Allergan’s Uniform P/E trades at 12.9x, below corporate average valuation levels and its own recent history.
High P/Es require high EPS growth to sustain them. In the case of Allergan, the company recently had a high 32% Uniform EPS growth.
While Wall Street stock recommendations and valuations poorly track reality, Wall Street analysts have a strong grasp on near-term financial forecasts like revenue and earnings.
As such, we use Wall Street GAAP earnings estimates as a starting point for our Uniform Earnings forecasts. When we do this, we can see that Allergan is forecast to only see Uniform EPS shrinkage of 80% in 2019 followed by 422% in 2020.
Based on current stock market valuations, we can back into the required earnings growth rate that would justify $197 per share. These are often referred to as market embedded expectations.
In order to meet the current market valuation levels of Allergan, the company would have to shrink Uniform EPS growth by 13% each year over the next three years.
What Wall Street analysts expect for Allergan’s earnings growth is far above than what the current stock market valuation requires.
To conclude, Allergan’s Uniform earnings growth is lower than peer averages in 2019. Also, the company is trading below peer valuations.
The company’s earnings power is 6x corporate averages, signaling that there is somewhat stable cash flow risk to the company’s operations and credit profile in the future.
Best regards,
Joel Litman & Rob Spivey
Chief Investment Strategist &
Director of Research
at Valens Research