
This mutual fund doesn’t diversify, because it doesn’t need to

You’ve probably heard that a well-diversified portfolio is the key to long-term investing success. But that’s not necessarily true. It is the key to a safe portfolio, not necessarily a good portfolio.
Today, we are looking at a fund that doesn’t diversify because it doesn’t need to, and we’ll use the right Uniform Accounting metrics to understand exactly why.
In addition to examining the portfolio, we’re including a deeper look into the fund’s largest current holding, providing you with the current Uniform Accounting Performance and Valuation Tearsheet for that company.
Investor Essentials Daily:
Friday Uniform Portfolio Analytics
Powered by Valens Research
Investing coaches and advisors will often tell you that holding a well-diversified portfolio is the sure-fire way to create long-term wealth. But before you buy shares of SPY or QQQ, let’s take a moment to explore this idea some more.
The stock market is a fundamentally risky venture while we, the investors, are risk-averse. That isn’t just hyperbole. The desire to avoid the possibility of loss is actually neurologically etched into human’s brains.
The human brain is hardwired to respond more negatively to loss than positively to gain. This is a cornerstone concept of behavioral economics called Prospect Theory, which was developed in 1979 by Daniel Khaneman and Avos Tversky as an alternative to Utilitarian Theory.
Prospect theory manifests in much of how we live our day-to-day lives. It shows up every time we make decisions with uncertain outcomes. It also affects how we invest our money.
If given a choice between a sure-fire $10,000, or an 80% chance to win $12,500, the brain will tend to favor the first option. The utilitarian value of the two scenarios is equal, but our subconscious biases often prevent us from acting rationally.
Prospect theory may inform why diversification is the de-facto investing strategy for most investors. Historically, the stock market has grown about 10% per year, on average, and will probably continue to do so over the long-run. Many investors favor the sure-fire 10% over the risk associated with stock-picking.
Given that financial wealth is so intertwined with the fabric of our society, investors can’t be blamed for wanting to protect their stock.
And yet, most of the people we talk about, think about, and aspire to be did not get to where they are by avoiding risks, or by hedging their bets.
Jeff Bezos did not work a safe and consistent desk job while founding Amazon, in case his moonshot didn’t work out. Nor did Bill Gates have five companies going at once at the start of his career, he was committed to Microsoft. Mike Bloomberg left his safe and very high-paying investment banking gig to dive head-first into his bet on investment data.
Seldom will you find someone who made their dreams come true by spreading their investment and time around. Focusing deeply on one thing you do best is by far and away the best way to “make it.”
Even Warren Buffet, who is often thought to be the “safe” investor, once said that “diversification is a protection against ignorance. It makes little sense if you know what you’re doing.”
If an investor finds a company they understand and have true conviction in, then diluting their portfolio with other stocks in the interest of “diversification” just limits their returns. This assumes, of course, that they did the right research and plenty of due diligence.
But we are wired to take the safe route.
Even on Wall Street, some of the largest hedge funds that made their names by pushing aggressive, well-researched strategies to crush the market, now hold over fifty positions with only a few percent of their portfolios invested in any singular bet.
For example, think back to Point72, last week’s highlighted portfolio. A risk-seeking, aggressive fund still looks relatively similar to the indexes that investors could buy for free, like the S&P 500 or the Nasdaq100. It holds more than one thousand public equity positions.
Today’s fund, however, has a different approach, and Uniform Accounting will help us understand why it works.
EdgePoint Investment Group has gone squarely down the path of stock-picking. Its premier fund, the global growth fund, only holds 38 positions. Half of the portfolio’s value is concentrated in just ten names.
EdgePoint’s incredibly light team of eight, spearheaded by Tye Bousada and Geoff MacDonald, manages $21 billion worth of assets. All of EdgePoint’s funds have grown at about a 14% CAGR since their inception between 2008 and 2010.
Unlike the other asset managers we have recently highlighted, Edgepoint isn’t a hedge fund—it markets mutual funds that investors can access via a set of financial advisors that the firm trusts. While the barrier to entry is higher than for a publicly-traded ETF, it is a far cry from the millionaires’ and billionaires’ clubs that are Coatue, Elliott, and Point72.
For the average investor, it is more relevant to understand what this sort of fund does because it too cannot use the warlike tactics of Elliott or the private equity access of Coatue to supplement a lackluster public equity portfolio.
Let’s dive into the ten largest American-traded companies held by Edgepoint’s Global Growth fund to better understand why Bousada and MacDonald are so bullish on so few names.
Take a look.
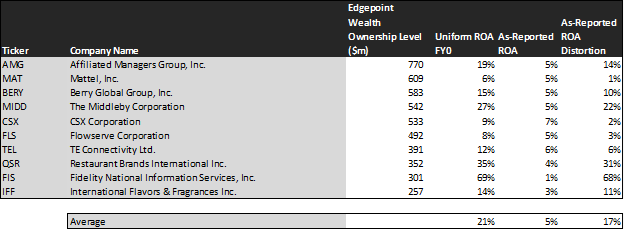
Here at Valens, Return on Assets is our favorite measure of corporate performance because it quantifies scaled economic productivity. Due to the distortions inherent to the Generally Accepted Accounting Principles (or GAAP), which is the rulebook by which American companies report their finances, the numbers perceived by the public are actually a far cry from reality.
Our Uniform Accounting framework corrects the deficiencies of GAAP. We make over 130 adjustments to the financial statements of every company to isolate real performance from the noise.
Among these ten holdings, we can see that average as-reported ROA is a mere 5%, which is roughly equivalent to the cost of capital. Real economic metrics show a completely different picture, with an average Uniform ROA of 21%, which is well above the corporate average.
The Middleby Corporation (MIDD), one of the fund’s largest holdings, is a great example. The company, which sells a range of industrial kitchen equipment to food processing facilities and restaurants, doesn’t return 5% on its asset base, but actually 27%. Although the pandemic has been a recent headwind, MIDD has historically been a robust 40% Uniform ROA business, and EdgePoint is likely correct to bet that this will continue.
Moreover, Fidelity (FIS) doesn’t return a dismal 1%, but actually 69%. The firm is using its cash-cow brokerage and banking software products to fund growth projects that could hugely benefit and expand the scope of the business.
However, to find companies that can deliver alpha beyond the market, just finding cases where as-reported metrics mis-represent real profitability is insufficient.
To really generate alpha, any investor also needs to identify where the market is significantly undervaluing the company’s potential.
Picking undervalued companies is hugely important to how EdgePoint delivers value. However, it is no easy feat. The founders once said that at the fund’s inception, they needed to sift through 100 companies to find five that are investible. Nowadays, they say they need to sift through over 300 to just find one. This is a lofty task for a team of only eight.
As the following chart shows, their efforts have paid off.

This chart shows three interesting data points:
– The first datapoint is what Uniform earnings growth is forecast to be over the next two years, when we take consensus Wall Street estimates and we convert them to the Uniform Accounting framework. This represents the Uniform earnings growth the company is likely to have, the next two years.
– The second datapoint is what the market thinks Uniform earnings growth is going to be for the next two years. Here, we are showing how much the company needs to grow Uniform earnings in the next 2 years to justify the current stock price of the company. If you’ve been reading our daily and our reports for a while, you’ll be familiar with the term embedded expectations. This is the market’s embedded expectations for Uniform earnings growth.
– The final datapoint is the spread between how much the company’s Uniform earnings could grow if the Uniform Accounting adjusted earnings estimates are right, and what the market expects Uniform earnings growth to be.
The average company in the United States is forecasted to grow its earnings by 5% over the next two years. Meanwhile, Bousada and MacDonald have assembled a fund that is forecasted to grow earnings by over 32%.
More notably, the market thinks these companies will only grow at the average 5% rate. But the market doesn’t have the same industry-expertise or knowledge of company-specific undercurrents that the analysts do.
Said differently, EdgePoint has picked a fantastic portfolio of companies that not only have robust economic productivity, but also are under-appreciated by the market.
Affiliated Managers Group (AMG), the fund’s largest holding, is priced in to shrink earnings by 11% over the next two years. Analysts, however, recognize the quality of the firm’s investments and think earnings will grow by 32%. EdgePoint expects that the AMG share price will appreciate significantly when the news of better-than-expected performance eventually drops.
Mattel (MAT) also has a massive dislocation in expectations. The name rarely makes the news, but it’s massive portfolio of childrens’ brands like Barbie and Polly Pocket and licensing deals to sell toys for well-known entertainment franchises has significantly outperformed the toy industry in recent years.
Better yet, management has potentially transformative plans to turn the company into a far more profitable IP-driven business. Hence, analysts expect earnings to nearly triple, whereas the market only expects modest growth.
As longtime Investor Essentials readers already know, here at Valens, diligent and well-researched stock-picking is our bread and butter. Hence, we recognize a great portfolio when we see one.
Bousada and MacDonald have chosen some fantastic stocks. They don’t need diversification because they clearly do great research.
While we can use Uniform Accounting to piece together why EdgePoint chose these companies, the fund will never make its methods known. By subscribing to our Conviction Long List, you could see not only the companies that we think will have significant upside surprises, but also all of the reasons and research to back it up.
Read on to see a detailed tearsheet of one of Edgepoint’s largest holdings.
SUMMARY and Affiliated Managers Group, Inc. Tearsheet
As one of Edgepoint’s largest individual stock holdings, we’re highlighting Affiliated Managers Group, Inc.’s tearsheet today.
As the Uniform Accounting tearsheet for Affiliated Managers Group, Inc. (AMG:USA) highlights, its Uniform P/E trades at 7.9x, which is below the global corporate average of 23.7x, but around its own historical average of 7x.
Low P/Es require low, and even negative, EPS growth to sustain them. In the case of Affiliated Managers Group, Inc., the company has recently shown a 13% Uniform EPS shrinkage.
While Wall Street stock recommendations and valuations poorly track reality, Wall Street analysts have a strong grasp on near-term financial forecasts like revenue and earnings.
As such, we use Wall Street GAAP earnings estimates as a starting point for our Uniform earnings forecasts. When we do this, Affiliated Managers Group, Inc.’s Wall Street analyst-driven forecast is a 66% EPS growth in 2021, followed by a 5% EPS growth in 2022.
Based on current stock market valuations, we can back into the required earnings growth rate that would justify Affiliated Managers Group, Inc.’s $158.44 stock price. These are often referred to as market embedded expectations.
What Wall Street analysts expect for Affiliated Managers Group, Inc.’s earnings growth is above what the current stock market valuation requires in 2021 and 2022.
The company’s earnings power is 3x corporate averages. That said, intrinsic credit risk is 150bps above the risk-free rate, signaling a moderate credit risk and low dividend risk.
To conclude, Affiliated Managers Group, Inc.’s Uniform earnings growth is above peer averages, and the company is trading below its average peer valuations.
Best regards,
Joel Litman & Rob Spivey
Chief Investment Strategist &
Director of Research
at Valens Research