
The analysts are catching up to Berkshire’s brilliance, and Buffett is betting that the market will too.

As a bidding war to buy a massive railroad company plays out, we at Valens are reminded of Warren Buffett’s outright purchase of his own massive railroad magnate.
As a thought-leader and a brilliant investor, Buffett is worth keeping track of. This week, we are taking another look at Berkshire Hathaway to see what’s changed and how things are going.
In addition to examining the portfolio, we’re including a deeper look into the fund’s largest current holding, providing you with the current Uniform Accounting Performance and Valuation Tearsheet for that company.
Investor Essentials Daily:
Friday Uniform Portfolio Analytics
Powered by Valens Research
Recently, there has been a bidding war in the news between the major North American railroad companies.
Kansas City Southern, the smallest of the major freightline providers, is up for sale and Canadian Pacific and Canadian National have been dueling it out for ownership.
A successful acquisition of Kansas City Southern would give them access to a wider swath of the southern United States port traffic, and open new routes into Mexico, transforming the scope of either business. After accepting deals from both buyers and flip-flopping between them, it currently appears that Kansas City Southern will move forward with Canadian National.
This type of consolidation in the railroad industry is garnering a lot of attention because these companies run natural geographic monopolies. There are virtually no paths for new entrants to break in.
Yet all the while, people continue to ship more and more every year. The combination of this secular growth and the impenetrable economic moats has driven the wave of consolidation that occured in the rail industry over a decade ago.
But it wasn’t a rail company at the heart of it all. It was an investor who loves companies that “bet on America,” have deep economic moats, and are misunderstood.
We are, of course, talking about Warren Buffett, and his 2009 acquisition of BNSF.
He loved the business so much that his asset management firm, Berkshire Hathaway, didn’t just take a position in BNSF, but acquired it outright.
Buffett’s mantra of buying cheap companies that he knows will still be relevant in 40 years has made him a billionaire many times over. But as-reported metrics don’t make it clear how good the businesses he bets on are.
For that, we need Uniform accounting.
But before we dig into his portfolio, a quick refresher at why we pay so much attention to what he does.
In the world of value investing, Ben Graham is the father, and maybe now also the grandfather. Between Security Analysis in 1934 and Intelligent Investor published in 1949, he laid down the core framework that many of the greatest value investors have used and still build on today.
However, in 1934, while Ben Graham was writing Security Analysis, he was also attempting to get his own Broadway musical produced.
Graham had written Baby Pompadour, a play about a journalist whose writing is influenced by his singer mistress.
It had a semi-successful off-Broadway run, and Graham had gotten Irving Steinman, a producer, to back the production’s Broadway launch.
Steinman just had one condition, his fiancée, who was apparently not a very talented singer or actress, had to be the lead.
The play opened at the Vanderbilt Theater that stood for more than 35 years on West 48th Street. It ran for just one week.
It was a disaster. Critics panned the musical.
One stated:
“Graham had better…find himself a new hobby”
Another wrote:
“The only humor in his [Graham’s] comedy comes during those pathetic moments when the unfortunate actors – who are here spared the humiliation of identification – find themselves with nothing more to do than laugh at their own pitiful jokes.”
The musical closed as a failure in short order, and Graham gave up on being a playwright, and instead turned his focus fully towards financial writing, investing, and teaching security analysis.
But while this failure may have been a big let-down for Graham, investors should be forever grateful that he was not successful as a playwright. Instead of dedicating his life to the arts, he dedicated his time to understanding investment research and teaching it to those who would listen.
Ben Graham’s greatest student was, of course, Warren Buffett. Buffett actually received an A+ in Graham’s investing class.
Warren Buffett summarized Graham’s teachings with this one comment:
“The basic ideas of investing are to look at stocks as businesses, use the market’s fluctuations to your advantage, and seek a margin of safety. That’s what Ben Graham taught us. A hundred years from now they will still be the cornerstones of investing.”
We also should be grateful that Graham didn’t have much success in the theater because if he had, Buffett might never have become the greatest practitioner of value investing.
Buffett studied under Graham shortly after Graham wrote Intelligent Investor. He earned his Master’s degree in Economics from Columbia in 1951. Studying under Ben Graham was a major draw for him in attending Columbia.
After leaving Columbia, Buffett took several stops through the world of finance, including working for Ben Graham’s investment partnership. Then, Buffett gained control of Berkshire Hathaway.
Once he obtained control, he started investing the holding company’s money applying Graham’s principles – and produced phenomenal returns.
Over 50 years, Buffett’s Berkshire Hathaway produced an annualized 21.7% return, compared to a 9.8% return for the S&P 500. That’s roughly 12% a year in annualized alpha.
A $1,000 investment in the S&P 500 in 1965 would have been worth $97,000 by 2014. That same $1,000 invested in Berkshire Hathaway would have been worth over $15 million by 2014.
How does Buffett find companies where the market has mis-priced the business, offering a significant margin of safety and value investing opportunity?
One thing is for sure…he is not relying on the as-reported GAAP earnings numbers to conduct his analysis.
Buffett has said quite bluntly time and time again:
“The net earnings figure… it really is not representative of what’s going on in the business at all…”
“The GAAP rules… I’ve warned you about the distortions.”
“The ‘bottom line’ figures are totally capricious. It’s really a shame”
“You should concentrate on the world of companies, not arcane accounting mathematics.”
Buffett has regularly railed against issues with as-reported accounting metrics. He’s mocked the changes with net income causing Berkshire’s earnings to swing quarter to quarter in ways that completely misrepresent the company’s performance.
Buffett is not alone in recognizing that as-reported earnings numbers and other financial statement data are terribly problematic and misleading. He is certainly one of the more outspoken on the issue.
If the earnings number is not reliable, then neither is the as-reported earnings growth number. That makes the P/E, price to earnings ratio, just as useless.
Graham mentions the importance of a company’s “earning power” over a hundred times in his books. Unfortunately, as-reported earnings is a poor metric for examining a firm’s earning power.
So any examination of Buffett’s portfolio, or your portfolio, using as-reported data would be a complete waste of time. It might be worse than that. Using as-reported financial data could cause you to make some very bad decisions… buying businesses that you shouldn’t, and selling businesses that you ought to have held.
That’s why Uniform Accounting and Uniform Financial Analytics are so powerful. Financial data that reflect the real economic performance and valuation of firms are necessary for great value investing. They unlock and reveal insights about the world of companies that arcane accounting – the existing accounting – hides and misleads.
Berkshire’s internal analysis unsurprisingly lines up directly with analysis using cleaned-up, consistent financial metrics calculated with Uniform Accounting.
We’ve conducted a portfolio audit of Berkshire’s top 15 American, non-financial holdings, based on its most recent 13-F, to see how Buffett’s investments are doing in the second half of 2021.
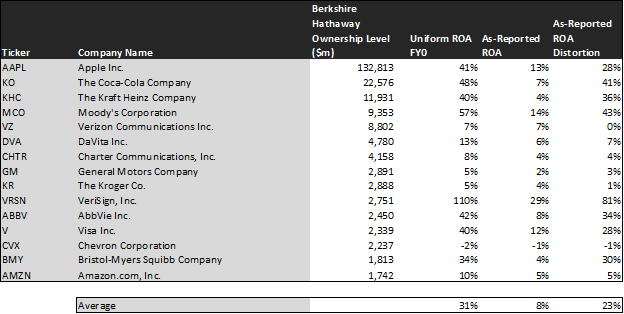
On an as-reported basis, many of these companies are poor performers with returns at 10% or below, with the average as-reported return on assets (ROA) right around 8%.
In reality, the average company in the index displays an impressive average Uniform ROA of 31%.
Once we make Uniform Accounting (UAFRS) adjustments to accurately calculate earnings power, we can see the underlying strength of the portfolio.
Once the distortions from as-reported accounting are removed, we can see Apple (AAPL) does not have a return of 13%, but a robust ROA of 41%. Although Buffett has historically chosen not to bet on tech companies, his decision to invest in 2016 has since made him over $100 billion.
Similarly, we can see that the Kraft Heinz Company (KHC), one of his most famous investments, does not return below the cost of capital at 4%, but actually ten times that.
The list goes on from there, for names ranging from Moody’s (MCO) and Visa (V), to AbbVie (ABBV) and Coca-Cola (KO).
The makeup of Buffett’s top holdings has seen some changes since we last reviewed the portfolio in March.
Most notably, after investing heavily into Chevron (CVX) earlier this year, Buffett has recently halved his position.
Also, Mastercard (MA) and pharmaceutical company Merck & Co (MRK) have both moved out of the top fifteen holding positions, while Berkshire added millions of shares of Kroger, moving it onto the list.
Additionally, Amazon (AMZN) has inched its way onto the bottom of the list. In a move uncharacteristic of Buffett’s playbook, Berkshire picked up shares of AMZN in 2019. The decision actually came not from Buffett, but his other two portfolio managers, who felt the company shouldn’t miss out on Amazon’s domination of the e-commerce business.
Now, let us see how these firms’ returns can strengthen over time through EPS growth.
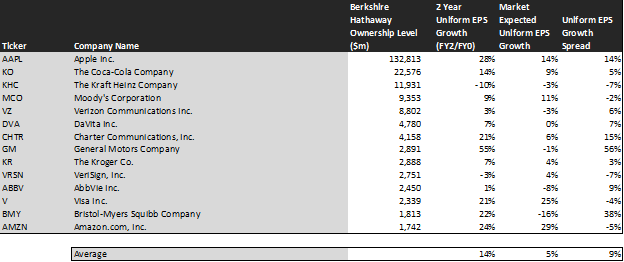
This chart shows three interesting data points:
– The first datapoint is what Uniform earnings growth is forecast to be over the next two years, when we take consensus Wall Street estimates and we convert them to the Uniform Accounting framework. This represents the Uniform earnings growth the company is likely to have, the next two years.
– The second datapoint is what the market thinks Uniform earnings growth is going to be for the next two years. Here, we are showing how much the company needs to grow Uniform earnings in the next 2 years to justify the current stock price of the company. If you’ve been reading our daily and our reports for a while, you’ll be familiar with the term embedded expectations. This is the market’s embedded expectations for Uniform earnings growth.
– The final datapoint is the spread between how much the company’s Uniform earnings could grow if the Uniform Accounting adjusted earnings estimates are right, and what the market expects Uniform earnings growth to be.
The average company in the U.S. is forecast to have 5% annual Uniform Accounting earnings growth over the next 2 years. In comparison, these top stocks are forecasted by analysts for 14% Uniform earnings growth.
On average, the market is pricing these companies to grow earnings in line with the expected corporate average. Analysts are forecasting higher expectations, which may mean the market is leaving some upside on the table.
One example of a company with high growth potential is Charter Communications (CHTR). Even though the market expects Charter Communications to grow earnings by 6%, analysts project the firm to grow by 21%.
Similarly, while the market is pricing Bristol-Myers Squibb Company (BMY) to contract its earnings by 16%, analysts are expecting earnings growth of 22% over the next two years.
More surprisingly, despite its massive valuation, even Apple appears undervalued. Analysts expect nearly 30% earnings growth, while the market is only pricing in half of that.
So what’s changed?
Compared to the last time we reviewed Berkshire Hathaway, the embedded expectations picture has notably improved. In March, 9 of the top 15 names had market expectations loftier than analyst expectations. This has reduced to just 5, which shows that analysts are seeing near-term tailwinds that the market has not yet come around on.
As would be expected for one of the thought-leaders behind how we view accounting and equity investing, Buffett continues to show that he is tracking the right metrics.
By gaining access to our research app, you can see the same numbers that Buffett does. You can learn more here.
SUMMARY and Apple Inc. Tearsheet
As Berkshire Hathaway’s largest individual stock holdings, we’re highlighting Apple Inc.’s tearsheet today.
As the Uniform Accounting tearsheet for Apple Inc. (AAPL:USA) highlights, its Uniform P/E trades at 24.0x, which is above the global corporate average of 21.9x and its own historical average of 18.5x.
High P/Es require high EPS growth to sustain them. In the case of Apple, the company has recently shown a 10% Uniform EPS growth.
While Wall Street stock recommendations and valuations poorly track reality, Wall Street analysts have a strong grasp on near-term financial forecasts like revenue and earnings.
As such, we use Wall Street GAAP earnings estimates as a starting point for our Uniform earnings forecasts. When we do this, Apple’s Wall Street analyst-driven forecast is a 73% EPS growth in 2021, followed by a 5% EPS shrinkage in 2022.
Based on current stock market valuations, we can back into the required earnings growth rate that would justify Apple’s $148 stock price. These are often referred to as market embedded expectations.
What Wall Street analysts expect for Apple’s earnings growth is above what the current stock market valuation requires in 2021, but below that requirement in 2022.
The company’s earnings power is 7x corporate averages. Additionally, cash flows are 3x their total obligations—including debt maturities, capex maintenance, and dividends. Together, this signals low credit and dividend risk.
To conclude, Apple’s Uniform earnings growth is above peer averages, but the company is trading around its average peer valuations.
Best regards,
Joel Litman & Rob Spivey
Chief Investment Strategist &
Director of Research
at Valens Research