
As ESG investing gains popularity, it’s time for investors to seriously consider the top ESG funds

As our society becomes more cognizant of the impact we have upon the planet, the interest in and demand for ESG (environmental, social, and governance) themed funds and companies has skyrocketed.
There’s a notion that it doesn’t “pay” to be ESG compliant, but that may not be true. Companies that treat their employees, customers, suppliers, and stakeholders equally tend to outperform the market.
Today, we’re taking a look at one of the premier, most well-respected ESG ETFs on the market.
In addition to examining the portfolio, we’re including a deeper look into the fund’s largest current holding, providing you with the current Uniform Accounting Performance and Valuation Tearsheet for that company.
Investor Essentials Daily:
Friday Uniform Portfolio Analytics
Powered by Valens Research
Arguably one of the highest profile themes that has emerged in the investment world over the past five years is the idea of environmental, social, governance (ESG) investing.
This investment philosophy involves choosing companies that do not solely focus on profits, but rather on multi-stakeholder capitalism.
An ESG framework ensures companies are incentivized to reward their employees, protect the environment, and innovate to improve the world for future generations.
These firms also tend to make efforts to try and positively contribute to social issues. For example, ESG companies tend to avoid addictive products such as gambling.
ESG-focused companies also cultivate a strong alignment between management, employees, and the board of directors with long-term wealth creation and maximization.
Companies that exemplify ESG initiatives tend to generate more sustainable returns. As a result, these companies less often find their businesses disrupted by operational issues.
There’s an old saying that “endearing companies are enduring ones.”
This is especially true now that investors, particularly the younger generations of investors, are being more mindful of the types of investments they are willing to make. Thus, demand for and attention towards ESG investing has recently skyrocketed.
People are beginning to see the power of companies that are thoughtful to its employees, customers, suppliers, and every other member of its stakeholder group.
Even major equity investors like Norway’s sovereign wealth fund are starting to focus their investment strategies on ESG themes.
Some investors assume ESG companies and themes create no alpha over the market, since the market tends to reward bottom line earnings growth.
However, that’s been proven time and time again to be false. ESG activities may start as non-financial positive externalities, but they often translate to more sustainable corporate returns too.
A few weeks ago, we highlighted Blackrock’s iShares MSCI USA ESG Select ETF (SUSA), which can be found here.
One of the challenges with ESG investing, like many other areas of research in investing and elsewhere, is that there are no agreed upon approaches for determining which companies are really fostering ESG initiatives.
In fact, there was a recent Bloomberg article highlighting how there is almost no overlap across the three main players in the ESG grading space. They are Sustainalytics, MSCI, and FTSE.
So what is an investor to rely on in terms of where they get their data on companies’ governance and other metrics used?
Smart investors take a step back and view each rating within context, understanding that one reason for the confusion is each of these players in the rating space is capturing something slightly different.
It is crucial to be able to take that step back and understand that any ESG framework is just part of ensuring a company is run to maximize the value for all stakeholders. The goal is how companies can create long-term, sustainably high returns.
Investors must analyze everything from a company’s management team, employee engagement, and innovation, to its shareholder engagement.
Understanding how all these aspects of a company intertwine with a given business strategy can create longer-lasting profitability.
This is the goal of ESG investing, and it is not being discussed nearly enough.
One group that is doing this broader work is Concinnity Advisors, with its Global X Conscious Capital Companies ETF (KRMA).
The fund aggregates the data from each source on ESG and smart capital allocation to what they call multi-stakeholder operating system analytics.
Investors can essentially think of the Fund as an “ESG+” product offering.
And what we can see is that Uniform Accounting lines up with Concinnity’s investment philosophy.
Identifying companies that operate holistically in a multi-stakeholder operating system generate higher returns too.
We’ve conducted a portfolio audit of KRMA’s top equity holdings, based on its most recent 13-F, focusing on their non-financial company holdings.
We’re showing a summarized and abbreviated analysis of how we work with institutional investors to analyze their portfolios.
Unsurprisingly, KRMA’s research appears to line up with Uniform Accounting.
Uniform Accounting metrics highlight the company’s equity investments are much higher quality, and have higher potential, than the market and as-reported metrics imply.
See for yourself below.
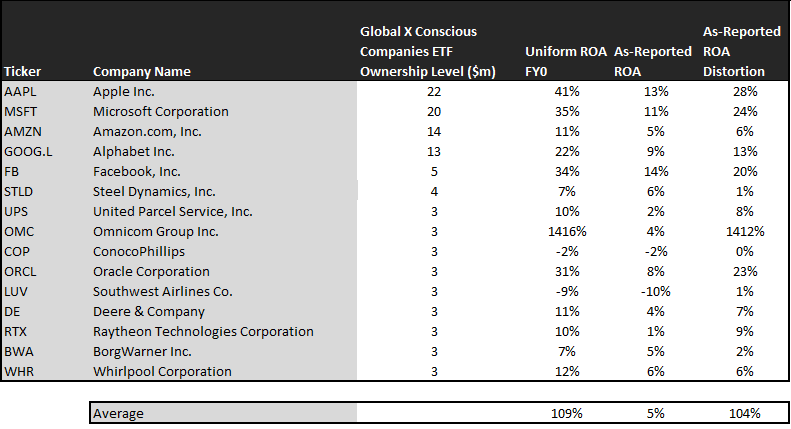
On an as-reported basis, many of these companies are below average performers with returns around 5%, less than half the current corporate average ROA of around 12%.
However, once we make Uniform Accounting (UAFRS) adjustments to accurately calculate earning power, we can see that the returns of the companies in KRMA’s portfolio are much more robust.
The average company in the portfolio displays an impressive average Uniform return on assets (ROA) at 109%. This is about 9x higher than corporate average returns.
Once the distortions from as-reported accounting are removed, we can realize Omnicom Group (OMC) doesn’t have an ROA of 4%, but returns of 1,416%. Omnicom isn’t a low-return business, it’s a company with robust cash flows.
Similarly, Microsoft’s (MSFT) ROA is really 35%, not 11%. KRMA’s focus on ESG companies seems to generate robust returns.
Apple (AAPL) is another great example of as-reported metrics mis-representing the company’s profitability.
Apple’s ROA isn’t 13%, it’s actually 41%.
The list goes on from there, for names ranging from Facebook (FB) and Alphabet Inc. (GOOGL), to Oracle (ORCL) and Raytheon Technologies (RTX).
If investors analyzed KRMA’s portfolio using as-reported metrics, it would look significantly weaker.
To find companies that can deliver alpha beyond the market, just finding companies where as-reported metrics mis-represent a company’s real profitability is insufficient.
To generate real alpha, any investor also needs to identify where the market is significantly undervaluing the company’s potential.
KRMA’s ESG+ portfolio contains a number of companies that the market has low expectations for – low expectations the companies can exceed.
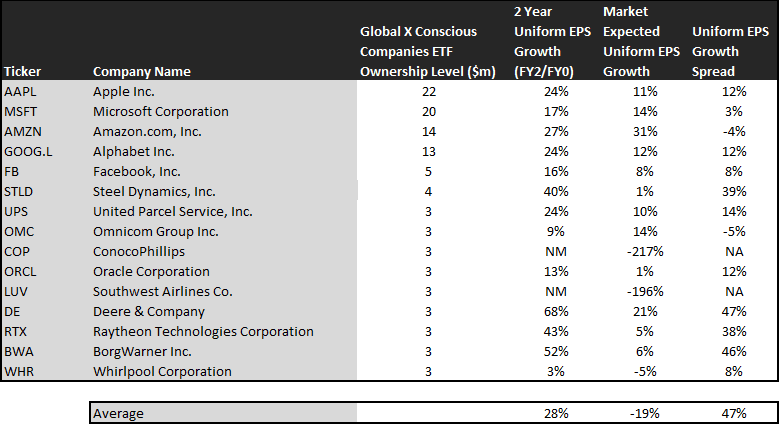
This chart shows three interesting data points:
- — The first datapoint is what Uniform earnings growth is forecast to be over the next two years, when we take consensus Wall Street estimates and we convert them to the Uniform Accounting framework. This represents the Uniform earnings growth the company is likely to have, the next two years.
- — The second datapoint is what the market thinks Uniform earnings growth is going to be for the next two years. Here, we are showing how much the company needs to grow Uniform earnings in the next 2 years to justify the current stock price of the company. If you’ve been reading our daily and our reports for a while, you’ll be familiar with the term embedded expectations. This is the market’s embedded expectations for Uniform earnings growth.
- — The final datapoint is the spread between how much the company’s Uniform earnings could grow if the Uniform Accounting adjusted earnings estimates are right, and what the market expects Uniform earnings growth to be.
The average company in the U.S. is forecast to have 5% annual Uniform Accounting earnings growth over the next 2 years. KRMA’s holdings are forecast by analysts to shrink by 1%.
Despite this, the market is pricing these companies to shrink earnings by 19% a year on average. While these companies are growing faster than the market, they are intrinsically undervalued, as the market is mispricing their growth by a staggering 18% on average.
These are the kinds of companies that are likely to see their stocks rally when the market realizes growth potential. This may be the market pricing some of these companies for massive declines in profitability in distressed credit situations. Without Uniform numbers, investors cannot see the strength of these names.
One example of a company in the portfolio that has growth potential the market is mispricing is Deere & Company (DE). Deere’s analyst forecasts have 68% Uniform earnings growth built in, but the market is only pricing the company to have earnings growth by 21% earnings each year for the next two years.
Another company with dislocations is Raytheon Technologies (RTX). While it may not look like its ESG initiatives are helping the firm, Uniform Accounting helps show that sustainable investments help with long-term profitability.
Market expectations call for a 6% growth in earnings. However, the company is actually forecast for Uniform EPS to grow by 43% a year. RTX only has to overcome these sluggish expectations to see upside.
For the most part, KRMA’s holdings are high quality, undervalued names with businesses displaying strong earning power, in many cases thanks to their ESG commitments. This wouldn’t be clear under GAAP, but unsurprisingly Uniform Accounting and a system built to deliver alpha see the same signals.
SUMMARY and Apple Inc. Tearsheet
As our Uniform Accounting tearsheet for Apple Inc. (AAPL:USA) highlights, Apple’s Uniform P/E trades at 22.1x, which is below the corporate average valuation of 23.7x, but above its own historical valuation of 18.4x.
Moderate P/Es require moderate EPS growth to sustain them. In the case of Apple, the company has recently shown a 10% Uniform EPS growth.
Wall Street analysts provide stock and valuation recommendations that in general provide very poor guidance or insight. However, Wall Street analysts’ near-term earnings forecasts tend to have relevant information.
We take Wall Street forecasts for GAAP earnings and convert them to Uniform earnings forecasts. When we do this, Apple’s Wall Street analyst-driven forecasts are 58% EPS growth in 2021 and 3% EPS shrinkage in 2022.
Based on current stock market valuations, we can back into the required earnings growth rate that would justify Apple’s stock price of $127.45 per share. These are often referred to as market embedded expectations.
The company is currently being valued as if Uniform earnings were to grow 10% annually over the next three years. What Wall Street analysts expect for Apple’s earnings is above what the current stock market valuation requires in 2021, but below that requirement in 2022.
Furthermore, the company’s earning power is 7x the corporate average. Also, cash flows and cash on hand are 4x its total obligations—including debt maturities, capex maintenance, and dividends. Together, this signals a low credit and dividend risk.
To conclude, Apple’s Uniform earnings growth is well above its peer averages, and its valuations are traded above its average peers.
Best regards,
Joel Litman & Rob Spivey
Chief Investment Strategist &
Director of Research
at Valens Research


