
Not all car companies are credit risks

The automotive sector saw a big shift during the pandemic. Problems with the supply chain led people to wait for months to get a new car. Thus, the demand rotated to the alternative: used cars.
However, as demand for used cars surged, their prices briefly matched or even exceeded new car prices, causing mispricings in the market.
After the fact, car dealerships restocked to get the market back to normal. And right when that happened, demand slowed way down. Today, far fewer people are buying cars, and as we inch towards a recession, that could keep trending in the wrong direction.
Seeing these problems in the automotive sector, rating agencies became highly concerned about the challenges and uncertainties faced by the industry. This led them to have an industry bias toward these businesses.
One victim of this industry-bias has been Cars.com (CARS). It is a digital marketplace for buying and selling cars.
Today, we’ll take a look at the company using Uniform Accounting and see if rating agencies were fair while assessing its credit risk profile.
We can use Uniform Accounting to put the company’s real profitability up against its obligations and decide for ourselves the true risk of this business.
Also below, a detailed Uniform Accounting tearsheet of the company.
Investor Essentials Daily:
Wednesday Credit Insights
Powered by Valens Research
The pandemic really shook up the car industry, bringing unexpected outcomes in the used car market.
Total car production went down by 16% in 2020, due to supply chain issues and lockdowns. This affected lead times significantly and people who wanted new cars had to wait a long time, even up to a year for some.
This situation drove the demand for used cars and led to their prices skyrocketing in a short period of time. The average used car price went up by 10% in April 2021, the highest it’s been since 1953. And after a year, it jumped by 30%.
However, this trend hit a road bump. As used car prices became expensive and people had to wait a long time to get a new car, demand started to fall.
On top of that, people started using cars much less frequently due to the pandemic and as more people were working from home.
This volatility in demand and prices in the automotive industry significantly affected the financial health of car retailers. For instance, one of the most popular used car retailers Carvana (CVNA) almost went bankrupt.
Rating agencies saw these disruptions in the automotive market as a sign to be more cautious about the car industry.
The asset-light automotive companies were impacted the most by this action since the outlook was much more negative for them as they could not provide collateral.
Cars.com (CARS) is a great example of this. The company operates an online marketplace where buyers and sellers connect to discuss deals and conduct transactions for cars.
The company does not produce any cars, nor is it a dealer. It’s just a digital platform.
For that reason, it doesn’t really need to invest in new assets and it has a much lower operating cost than a lot of its peers, who are struggling. These advantages keep the business afloat even during economic downturns.
However, rating agencies do not see it this way, due to their negative bias on the automotive industry.
S&P has rated the company “B+”. This rating implies a massive chance of default, around 25% over the next few years. It also places the company among the risky high-yield basket.
Considering the company’s asset-light business model and the advantages that brings, Cars.com should have a much safer credit rating.
We can figure out if there is a real risk for this company by leveraging the Credit Cash Flow Prime (“CCFP”) to understand how the company’s obligations match against its cash and cash flows.
In the chart below, the stacked bars represent the firm’s obligations each year for the next five years. These obligations are then compared to the firm’s cash flow (blue line) as well as the cash on hand available at the beginning of each period (blue dots) and available cash and undrawn revolver (blue triangles).
The CCFP chart shows that Cars.com’s cash flows are more than enough to serve all its obligations going forward.
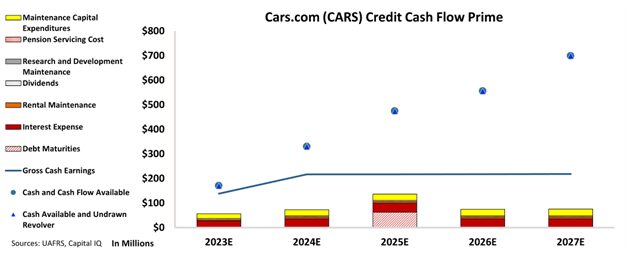
The chart shows that the company should have no difficulty with meeting its obligations over the next five years.
Thanks to its asset-light marketplace business model, the company’s only non-debt obligation is about $20 million in maintenance every year, which is not concerning at all.
Additionally, the massive spread between its cash flows and obligations provides substantial flexibility to the company in case of an economic downturn.
All these factors point out that the company is not facing a significant chance of default as rating agencies suggest.
That is why we are giving an “IG3-” rating to this company. This rating ensures that Cars.com is placed within the safer investment-grade basket and implies a chance of default of around 1%.
It is our goal to bring forward the real creditworthiness of companies, built on the back of better Uniform Accounting.
To see Credit Cash Flow Prime ratings for thousands of companies, click here to learn more about the various subscription options now available for the full Valens Database.
SUMMARY and Cars.com (CARS:USA) Tearsheet
As the Uniform Accounting tearsheet for Cars.com (CARS:USA) highlights, the Uniform P/E trades at 11.8x, which is below the global corporate average of 18.4x but above its historical P/E of 10.4x.
Low P/Es require low EPS growth to sustain them. In the case of Cars.com, the company has recently shown a 4% Uniform EPS shrinkage.
Wall Street analysts provide stock and valuation recommendations, that in general, provide very poor guidance or insight. However, Wall Street analysts’ near-term earnings forecasts tend to have relevant information.
We take Wall Street forecasts for GAAP earnings and convert them to Uniform earnings forecasts. When we do this, Cars.com’s Wall Street analyst-driven forecast is for a 23% and 3% EPS growth in 2023 and 2024, respectively.
Based on the current stock market valuations, we can use earnings growth valuation metrics to back into the required growth rate to justify Cars.com’s $21 stock price. These are often referred to as market-embedded expectations.
Furthermore, the company’s earning power in 2022 was 15x the long-run corporate average. Moreover, cash flows and cash on hand are 2x its total obligations—including debt maturities and capex maintenance. The company also has an intrinsic credit risk that is 500bps above the risk-free rate.
Overall, this signals a high credit risk.
Lastly, Cars.com’s Uniform earnings growth is above its peer averages and is trading below its average peer valuations.
Best regards,
Joel Litman & Rob Spivey
Chief Investment Strategist &
Director of Research
at Valens Research