
Custom passive investing may be the next big investment craze

ETFs have dominated the pooled security market over the past few years, but there is now a threat to their dominance.
That threat is custom indexing. Read on to learn more about what custom indexing is, and a detailed Uniform Accounting audit of a custom indexing heavyweight.
Also below, a detailed Uniform Accounting tearsheet of the fund’s largest holding.
Investor Essentials Daily:
Friday Uniform Portfolio Analytics
Powered by Valens Research
Investors who’ve been following Wall Street over the past several years may have noticed that there has been a subtle change in the world of pooled investment vehicles.
As we discussed yesterday, BlackRock (BLK) has been dominating with its market-matching investment products.
Passive, low-fee ETFs have become more popular than ever, while expensive actively managed products have struggled to attract investment.
In 2008, Americans had about $500 billion invested in ETFs. Today, it’s over $4 trillion.
ETFs have low fees and low upkeep requirements, making it harder for smaller asset managers to beat the big guys. Classic actively managed funds are losing popularity, but that won’t stop investment managers from looking for new ways to make money selling pooled investments.
With custom indexing, they may have found its answer.
We see this by the wave of new products and relevant acquisitions we’ve seen from major asset managers in recent years.
Franklin Templeton, for instance, just acquired O’Shaughnessy Asset Management. O’Shaughnessy lets customers build their own custom indexes through its proprietary software called Canvas.
So what exactly is custom indexing?
Let’s say a customer cares a lot about the environment and wants to hold the S&P 500. With Canvas, they can assemble a custom index identical to the S&P 500, but ditch the oil companies.
They can also take an existing index and tweak the weights, or change the rebalancing logic. There are infinite possibilities that allow customers to build portfolios with the diversification of an index, without needing to own one.
The wealthiest investors have been able to do this for decades, but as the process wasn’t automated it was prohibitively expensive.
The advent of fractional shares and ever-improving software capabilities now make it possible for investors with much smaller portfolios to expose themselves to hundreds of stocks, but without purchasing an index fund.
O’Shaughnessy’s flagship fund, the Market Leaders Value Fund (OFVIX), is a great example of what a custom index can offer investors. The index’s mandate focuses on matching the long-term capital appreciation potential of large-cap stocks with high “shareholder yield,” a metric that measures a combination of dividend yield and share buybacks.
Let’s evaluate the fund using Uniform Accounting, to see if it is positioned to generate real alpha.

Here at Valens, return on assets (“ROA”) is our favorite measure of corporate performance because it quantifies scaled economic productivity. Due to the distortions inherent to the Generally Accepted Accounting Principles (or GAAP), which is the rulebook by which American companies report their finances, the numbers perceived by the public are actually a far cry from reality.
Our Uniform Accounting framework corrects the deficiencies of GAAP. We make over 130 adjustments to the financial statements of every company to isolate real performance from the noise.
To the untrained eye, it may appear that OFVIX is a collection of mediocre companies barely returning above the cost capital, at 6% ROA. In reality, these companies are far more profitable, with an average Uniform ROA of 29%.
Take a look at Altria Group (MO). The tobacco company only reports a 15% ROA because its balance sheet is overinflated by non-operating assets, some of which (like goodwill) carry no real value. Smart investors like Warren Buffet would know not to count such assets when calculating ROA because they have nothing to do with the company’s operations.
As a result, Altria’s ROA isn’t 15%, but a stratospheric 245%. That makes it the most profitable company in the index.
However, investors also need to remember finding companies that perform well is an important first step in investing, but it does not hold the key to finding alpha.
Investors need to find those companies that perform well, but are priced to perform poorly. Without the visibility of Uniform Accounting, this may be difficult to quantify. Thanks to our team’s Embedded Expectations Analysis, we can see exactly what a company is priced to do.
The chart below compares analyst-expected returns with market-expected returns. When there is a severe dislocation between the two, it can often mean the market is failing to understand something about a company. See for yourself:
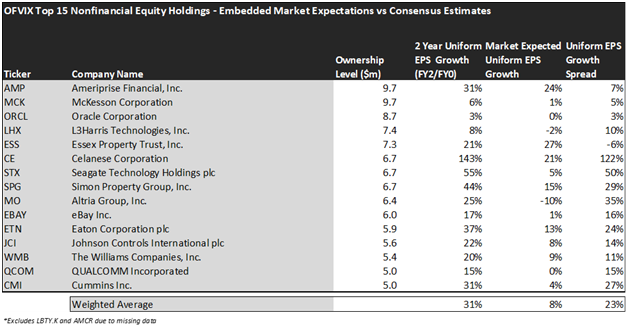
This chart shows three interesting data points:
- The 2-year Uniform EPS growth represents what Uniform earnings growth is forecast to be over the next two years. The EPS number used is the value of when we take consensus Wall Street estimates and we convert them to the Uniform Accounting framework.
- The market expected Uniform EPS growth is what the market thinks Uniform earnings growth is going to be for the next two years. Here, we show by how much the company needs to grow Uniform earnings in the next 2 years to justify the current stock price of the company. If you’ve been reading our daily analyses and reports for a while, you’ll be familiar with the term embedded expectations. This is the market’s embedded expectations for Uniform earnings growth.
- The Uniform EPS growth spread is the spread between how much the company’s Uniform earnings could grow if the Uniform earnings estimates are right, and what the market expects Uniform earnings growth to be.
While the market has priced these companies to grow their Uniform EPS by 8% over the next two years, analysts have far more bullish expectations. They expect Uniform EPS to grow by 31% over the same time frame.
This sets investors up favorably, as these analysts have better visibility into what the companies they cover are really doing. If the market has embedded worse expectations than analysts, these stocks could be set up for a wave of upside surprises as analyst expectations come to fruition.
For example, take a look at Seagate Technology Holdings (STX). While the company often flies under the radar as a hard drive manufacturer, analysts are predicting the firm to reach ROAs that it hasn’t seen since 2015. That was when cloud storage was less ubiquitous, and Seagate’s hard drives had more consumer relevance.
It seems as though the firm’s strategic initiatives are positioning it for recovery to those higher levels, but the market is not pricing it to see this improvement. While analysts expect Uniform EPS growth of 55% over the next two years, the market only expects growth of 5%.
Another example is eBay (EBAY). While the market is pricing the company to grow its Uniform EPS by 1% over the next two years, analysts are far more optimistic, with an expectation for 17% EPS growth.
Overall, OFVIX looks to be positioned for significant upside. With access to the Valens Research database, you could be too. The database offers access to full Uniform Accounting metrics for thousands of companies, so you can evaluate your investments using real, undistorted data.
Click here to get access.
Read on to see a detailed tearsheet of the largest holding in OFVIX.
SUMMARY and Ameriprise Financial, Inc. Tearsheet
As OFVIX’s largest individual stock holdings, we’re highlighting Ameriprise Financial, Inc.’s tearsheet today.
As the Uniform Accounting tearsheet for Ameriprise Financial, Inc. (AMP:USA) highlights, its Uniform P/E trades at 41.7x, which is above the global corporate average of 24.0x, but around its historical average of 42.7x.
High P/Es require high EPS growth to sustain them. In the case of AMP, the company has recently shown an immaterial Uniform EPS growth.
Wall Street analysts provide stock and valuation recommendations that, in general, provide very poor guidance or insight. However, Wall Street analysts’ near-term earnings forecasts tend to have relevant information.
We take Wall Street forecasts for GAAP earnings and convert them to Uniform earnings forecasts. When we do this, AMP’s Wall Street analyst-driven forecast is for EPS to grow by 80% in 2021 and shrink by 5% in 2022.
Based on the current stock market valuations, we can use earnings growth valuation metrics to back into the required growth rate to justify Ameriprise Financial’s $297 stock price. These are often referred to as market embedded expectations.
The company is currently being valued as if Uniform earnings were to grow 24% annually over the next three years. What Wall Street analysts expect for Ameriprise Financial’s earnings growth is above what the current stock market valuation requires in 2021, but below that requirement in 2022.
Meanwhile, the company’s earning power is below the long-run corporate averages. However, cash flows and cash on hand are around 6x total obligations—including debt maturities, capex maintenance, and dividends. Moreover, intrinsic credit risk is just 20bps. Together, these signal a low dividend and credit risk.
Lastly, AMP’s Uniform earnings growth is above peer averages, and the company is trading above its average peer valuations.
Best regards,
Joel Litman & Rob Spivey
Chief Investment Strategist &
Director of Research
at Valens Research