
Investors no longer need to put all their eggs in Cathie Wood’s ARK basket, as other stellar funds have hit the market

Innovation, from technological advances to brand new corporate structures, is the driving force transforming the U.S. in the next wave of industrial automation.
Today’s fund, MACG.X, has quickly gained attention for its stellar performance and great similarities to Cathie Wood’s ARK Innovation ETF.
In addition to examining the portfolio, we’re including a deeper look into the fund’s largest current holding, providing you with the current Uniform Accounting Performance and Valuation Tearsheet for that company.
Investor Essentials Daily:
Friday Uniform Portfolio Analytics
Powered by Valens Research
With the surge in interest in the tech world of investing, the ARK Innovation ETF has become a popular investment over the past few quarters.
As the fund has skyrocketed, investors might believe Cathie Wood, the woman behind the ARK Innovation ETF, has created a monopoly on investing in innovation.
We even highlighted ARK a few months ago in a report that can be found here.
However, that suspicion is anything but the case. There are plenty of funds that capture nascent growth companies or clean energy companies.
These funds are also focusing on innovative companies that have the potential to ignite large industries.
One other fund that focuses on similar drivers to Cathie Wood’s ARK Innovation ETF is the MACG.X mutual fund. The fund is Morgan Stanely’s Institutional Fund, which is a discovery portfolio.
The fund specifically focuses on a few special factors:
– Companies with sustainable competitive moats
– Above average business visibility
– The potential to earn high rates of return on capital
– The potential for massive amounts of long-term growth
Astute readers will notice how these factors are similar to the ones ARK Innovation is using, showing they are not the only ones in the space that is using alternative metrics to capture high growth companies across all industries.
However, by looking at the as-reported metrics of the fund, investors would assume the mutual fund is not doing a good job of finding companies that successfully fulfil the expected mold.
In reality, Uniform Accounting metrics show how robust the fund actually is. This makes more sense with the strategy of the fund, and shows why investors don’t need to put all their money in Cathie Wood’s ARK Innovation ETF to be exposed to these tailwinds.
We’ve conducted a portfolio audit of MACG.X’s top equity holdings, based on its most recent 13-F, focusing on their non-financial company holdings.
Uniform Accounting metrics highlight the company’s equity investments are much higher quality, and have higher potential, than the market and as-reported metrics imply.
See for yourself below.

Using as-reported accounting, investors might think MACG.X is buying names with low profitability levels. In reality, the firm sees through the accounting noise to pick up names markets are completely misunderstanding, often because of accounting issues.
On an as-reported basis, many of these companies are poor performers with negative returns. The portfolio has an average as-reported ROA of -2%.
However, once we make Uniform Accounting (UAFRS) adjustments to accurately calculate earning power, we can see that the returns of the companies in MACG.X’s portfolio are much more robust.
The average company in the portfolio displays an average Uniform return on assets (ROA) at 64%.
Once the distortions from as-reported accounting are removed, we can realize that ZoomInfo Technologies (ZI) doesn’t have an ROA of 3%, but returns of 791%. ZoomInfo Technologies isn’t a low-return company, it is a company with robust cash flows that MACG.X thinks is misunderstood by equity investors.
Similarly, 10x Genomics’ (TXG) ROA is really 49%, not -6%. MACG.X’s focus on better accounting recognizes a high return business with cash flows to handle obligations.
Wayfair’s (W) ROA isn’t 6%, it’s actually 57%. Uniform Accounting lines up with MACG.X’s decision making, Wayfair is really a high return business with ability to service its credit obligations.
The list goes on from there, for names ranging from Coupa Software (COUP) and Twilio (TWLO), to Veeva Systems (VEEV) and Twitter (TWTR).
If MACG.X’s investment strategy was powered by as-reported metrics, it would never pick most of these companies, because they look like bad companies and poor investments.
To find companies that can deliver alpha beyond the market, just finding companies where as-reported metrics mis-represent a company’s real profitability is insufficient.
To really generate alpha, any investor also needs to identify where the market is significantly undervaluing the company’s potential.
MACG.X is also investing in companies that the market has low expectations for which just may see a strong turnaround.
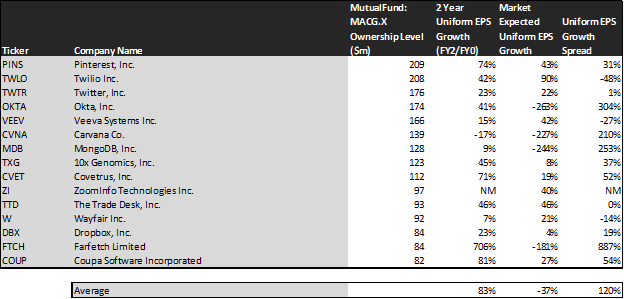
This chart shows three interesting data points:
– The first datapoint is what Uniform earnings growth is forecast to be over the next two years, when we take consensus Wall Street estimates and we convert them to the Uniform Accounting framework. This represents the Uniform earnings growth the company is likely to have, the next two years.
– The second datapoint is what the market thinks Uniform earnings growth is going to be for the next two years. Here, we are showing how much the company needs to grow Uniform earnings in the next 2 years to justify the current stock price of the company. If you’ve been reading our daily and our reports for a while, you’ll be familiar with the term embedded expectations. This is the market’s embedded expectations for Uniform earnings growth.
– The final datapoint is the spread between how much the company’s Uniform earnings could grow if the Uniform Accounting adjusted earnings estimates are right, and what the market expects Uniform earnings growth to be.
The average company in the U.S. is forecast to have 5% annual Uniform Accounting earnings growth over the next 2 years. MACG.X’s holdings are forecast by analysts to grow by 83%, well above average.
This is well more than the growth the market is currently pricing in. The market expects earnings to shrink by 37% for the next two years.
One example of a company in the MACG.X portfolio that has growth potential that the market is mispricing is Okta (OKTA). Okta’s analyst forecasts have 41% Uniform earnings growth built in, but the market is pricing the company to have earnings shrink by 263% each year for the next two years.
MongoDB (MDB) also has massive dislocations. The market expects MongoDB’s earnings to shrink by 244% over the next two years, while analysts project earnings to grow by 9%.
These types of directional distortions indicate the market may think innovation isn’t worth a premium, or that companies like MongoDB aren’t as innovative as they really are.
Yet another is the fund’s largest holding. Pinterest (PINS) is priced for a 43% growth by the market, when they are really forecasted to grow earnings by 74% a year.
For the most part, MACG.X’s holdings are high quality, undervalued companies with businesses displaying strong earning power. This wouldn’t be clear under GAAP, but unsurprisingly Uniform Accounting and a system built to deliver alpha see the same signals.
SUMMARY and Pinterest, Inc. Tearsheet
As our Uniform Accounting tearsheet for Pinterest, Inc. (PINS:USA) highlights, Pinterest’s Uniform P/E trades at 50.8x, which is above the corporate average valuation of 23.7x and its own historical valuation of 36.0x.
High P/Es require high EPS growth to sustain them. In the case of Pinterest, the company has recently shown a 37% Uniform EPS growth.
Wall Street analysts provide stock and valuation recommendations that in general provide very poor guidance or insight. However, Wall Street analysts’ near-term earnings forecasts tend to have relevant information.
We take Wall Street forecasts for GAAP earnings and convert them to Uniform earnings forecasts. When we do this, Pinterest’s Wall Street analyst-driven forecast is a 99% and 52% EPS growth in 2021 and 2022, respectively.
Based on current stock market valuations, we can back into the required earnings growth rate that would justify Pinterest’s stock price of $65.30 per share. These are often referred to as market embedded expectations.
The company is currently being valued as if Uniform earnings were to grow 43% annually over the next three years. What Wall Street analysts expect for Pinterest’s earnings is above what the current stock market valuation requires in 2021 and 2022.
Furthermore, the company’s earning power is 3x the corporate average. Also, cash flows and cash on hand are 6x its total obligations—including debt maturities and capex maintenance. Together, this signals a low credit risk.
To conclude, Pinterest’s Uniform earnings growth is well above its peer averages, and its valuations are traded in line with its average peers.
Best regards,
Joel Litman & Rob Spivey
Chief Investment Strategist &
Director of Research
at Valens Research