
John Paulson must be glad his unique investment strategy looks better than ever

John Paulson’s claim to fame was his bet against the housing market in the years leading up to the Great Recession. That bet made him and his clients $20 billion dollars.
Today, Paulson is back in the news. Sadly, it’s because his divorce adds to the list of high profile marriages to fall apart in the past year, which ironically reflects his most coveted investment strategy.
Let’s use Uniform Accounting to dig into his portfolio and see how that strategy looks on a fundamental basis.
In addition to examining the portfolio, we’re including a deeper look into the fund’s largest current holding, providing you with the current Uniform Accounting Performance and Valuation Tearsheet for that company.
Investor Essentials Daily:
Friday Uniform Portfolio Analytics
Powered by Valens Research
“The Big Short,” which premiered in 2015, is one of the most well regarded and critically acclaimed pieces of financial entertainment.
The movie follows the true story of Michael Burry, manager of Scion Capital from 2000 to 2008, as he bet against the housing market. He made hundreds of millions for his clients even as the Great Recession crippled the global economy.
Burry is widely regarded as the one and only investor who saw it all coming… but there was another.
Just like Burry, John Paulson was able to identify the unsustainable nature of mid-2000s mortgage-backed debt. Anticipating waves of loan defaults, he bought credit default swaps and made billions of dollars as the market crumbled.
He walked away from the financial crisis $4 billion richer. He netted his clients and other employees $16 billion off the trade. By comparison, his winnings make Michael Burry’s successes seem like small change.
Paulson is back in the news again. This time, unfortunately, it is not because of his brilliant investments.
Rather than generating new wealth, Paulson now needs to divide his fortune up. Another week, another high-profile divorce, it may seem. It will be a hefty fortune for the pair to break up, as he is reportedly worth well over $4 billion.
Ironically, it is precisely this sort of legal action, though not in the form of divorces, that Paulson’s hedge fund specializes in.
Paulson & Co Inc. (PCI), which manages $8.7 billion, makes money off of event arbitrage. These events can be mergers, acquisitions, divestitures, bankruptcies, or other credit events. Paulson & Co are some of the masters of complex credit strategies that require a deep understanding of the legal terms and nuances, much like another fund we’ve covered, Elliot Management.
But Paulson, unlike Elliot, is not an infamous activist. PCI seeks to find one-sided deals where there is a mismatch between entry and exit values after all is said and done.
Looking at its holdings now, its focus on special situations and arbitrage opportunities is as clear as ever.
One of PCI’s top holdings, Bausch Health (BHC), is currently divesting two of its major business lines. Paulson’s belief is that the companies will be worth more as separate entities, even after the expensive breakup proceedings, and hence owns a hefty 7% in the company.
Read on to see a detailed portfolio audit of PCI’s largest nonfinancial holdings.
Here at Valens, return on assets (“ROA”) is our favorite measure of corporate performance because it quantifies scaled economic productivity. Due to the distortions inherent to the Generally Accepted Accounting Principles (or GAAP), which is the rulebook by which American companies report their finances, the numbers perceived by the public are actually a far cry from reality.
Our Uniform Accounting framework corrects the deficiencies of GAAP. We make over 130 adjustments to the financial statements of every company to isolate real performance from the noise.
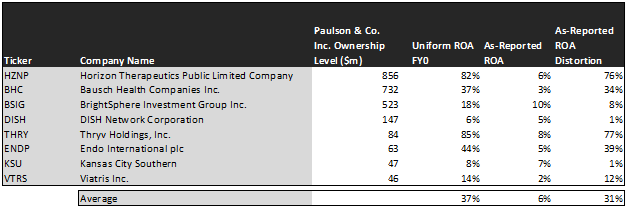
If you were to look at the above 8 holdings on an as-reported basis, you’d see an average ROA of 6%. That’s barely higher than the cost of capital.
In reality, half of PCI’s public holdings have a Uniform ROA of at least 37%, triple the overall corporate average.
Take a look at PCI’s largest holding, Horizon Therapeutics (HZNP). While most investors would see an ROA of only 6%, the company really has a robust Uniform ROA of 82%.
Similarly, take a look at Thryv Holdings (THRY). Paulson currently owns a nearly 9% stake in the business as it makes a stark transition from a legacy Yellowpages company to an agile SaaS player. Specifically, he has been pushing the firm to spin its SaaS business into a standalone company, which in his view can unlock more total value for investors.
Thryv reports an ROA of only 8%, below the corporate average. After removing balance sheet line items that unfairly inflate the company’s asset base, it really has a Uniform ROA of 85%.
However, to find companies that can deliver alpha beyond the market, just finding cases where as-reported metrics mis-represent real profitability is insufficient.
To really generate alpha, any investor also needs to identify where the market is significantly undervaluing the company’s potential.
Using our Embedded Expectations framework, we can quickly and accurately quantify the exact amount of future growth already priced into a stock.
See for yourself:
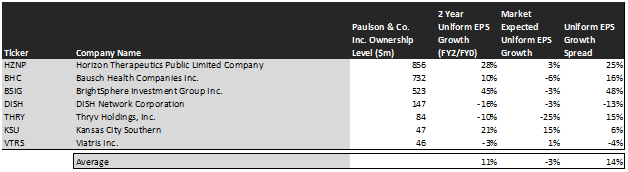
This chart shows three interesting data points:
– The first datapoint is what Uniform earnings growth is forecast to be over the next two years, when we take consensus Wall Street estimates and we convert them to the Uniform Accounting framework. This represents the Uniform earnings growth the company is likely to have, the next two years.
– The second datapoint is what the market thinks Uniform earnings growth is going to be for the next two years. Here, we are showing how much the company needs to grow Uniform earnings in the next two years to justify the current stock price of the company. If you’ve been reading our daily and our reports for a while, you’ll be familiar with the term embedded expectations. This is the market’s embedded expectations for Uniform earnings growth.
– The final datapoint is the spread between how much the company’s Uniform earnings could grow if the Uniform Accounting adjusted earnings estimates are right, and what the market expects Uniform earnings growth to be.
As you can see, the market is expecting these eight companies to contract their earnings by 3% over the next two years.
But analysts, who spend every day analyzing market conditions, earnings trends, and the efficacy of management initiatives have other ideas. They believe that these companies will grow their earnings base by 11%, double the expected corporate average growth rate.
This lines up with Paulson’s strategic goals. Many of these companies are undergoing transformations or events that may make the market nervous. But his team of analysts has identified opportunities in these events that the market is not pricing in.
Take a look at Bausch Health Companies, for example. While the market is pricing in a 6% setback in EPS, analysts expect the company’s spinoffs to be deeply accretive, and causing EPS to improve by 10%.
Similarly, the railroad magnate Kansas City Southern (KSU) has a 15% EPS growth priced into its current valuation. But as the other two major railroad goliaths, Canadian National and Canadian Pacific, duel over which gets to acquire Kansas City Southern, analysts expect EPS to grow by 21%.
Paulson, meanwhile, plans to hold the company through the groundbreaking merger.
PCI’s clever event arbitrage strategy yields a set of investments that look very promising on a Uniform basis.
This just demonstrates the importance of embedded expectations. When changes occur in the marketplace, there is often a window of opportunity when those who are in-the-know can beat the market to the realization that there is money on the table.
These changes can occur on a company level, and also on a macroeconomic level. It is exactly what drove Paulson to make his historic bet against the housing market in the years leading up to the financial crisis.
Keeping investors in-the-know about the macroeconomic developments that the rest of the market may be missing has always been a core piece of the Valens Research mission.
It is why we offer the Market Phase Cycle, which uses developments in the credit markets, inflation, unemployment, management confidence levels, and countless other indicators to prepare investors for what comes next on the macroeconomic level.
To learn more about the most comprehensive and actionable macroeconomic research report in circulation, click here.
Read on for a detailed tear sheet of one of Paulson’s biggest bets.
SUMMARY and Bausch Health Companies Inc. (BHC:USA)
As one of Paulson & Company’s largest individual stock holdings, we’re highlighting Bausch’s tearsheet today.
As our Uniform Accounting tearsheet for Bausch Health Companies Inc. (BHC:USA) highlights, its Uniform P/E trades at 11.5x, which is below the global corporate average of 24.3x, but around its own historical average of 11.0x.
Low P/Es require low, and even negative, EPS growth to sustain them. In the case of Bausch, the company has recently shown an immaterial Uniform EPS growth.
Wall Street analysts provide stock and valuation recommendations that, in general, provide very poor guidance or insight. However, Wall Street analysts’ near-term earnings forecasts tend to have relevant information.
We take Wall Street forecasts for GAAP earnings and convert them to Uniform earnings forecasts. When we do this, Bausch’s Wall Street analyst-driven forecast is for EPS to shrink by 35% in 2021, but grow by 76% in 2022.
Based on current stock market valuations, we can back into the required earnings growth rate that would justify Bausch’s $29 stock price. These are often referred to as market embedded expectations.
The company is currently being valued as if Uniform earnings were to shrink by 11% annually over the next three years. What analysts expect for Bausch’s earnings growth is below what the current stock market valuation requires for 2021, but above the requirement in 2022.
Furthermore, the company’s earning power is 6x the long-run corporate averages. However, cash flows and cash on hand are below its total obligations—including debt maturities, capex maintenance, and dividends by 2025. Moreover, Bausch’s intrinsic credit risk is 110 bps. Together, these signal a moderate credit and dividend risk.
Lastly, Bausch’s Uniform earnings growth is in line with its peer averages, and the company is trading in line with its average peer valuations.
Best regards,
Joel Litman & Rob Spivey
Chief Investment Strategist &
Director of Research
at Valens Research


