
Supply chain headwinds are occluding common sense for MKS Instruments

The supply chain breakdown in the semiconductor business has shrouded the industry in a cloud of uncertainty. Equity investors don’t know where to turn, and we can’t blame them.
But on the credit side, the picture is clear. MKS Instruments is rated as a serious liability to its creditors, but an honest look at the numbers shows a completely different story.
Also below, a detailed Uniform Accounting tearsheet of the company.
Investor Essentials Daily:
Wednesday Credit Insights
Powered by Valens Research
Back in June, we first highlighted MKS Instruments (MKSI) as an interesting name operating in the semiconductor space.
As one of the key equipment suppliers for semiconductor manufacturing sitting amidst a massive semiconductor demand cycle, it was producing impressive Uniform return on assets (“ROA”).
But as we so often see, its as-reported metrics made it look like a company with middling profitability, keeping it off the radars of many equity investors.
However, the semiconductor shortage that has since lurched the global supply chain into disrepair was only beginning to emerge as a documented market theme at the time.
Semiconductors typically take 12 weeks to make, a period known as the “cycle time.” But during a demand-induced capacity ramp, those cycle times double. As manufacturing restarted, chipmakers found themselves dealing with half-year long cycle times.
Moreover, the social distancing protocols in factories further slowed the manufacturing process. The combination of bringing chip-making facilities back online while also building capacity to meet a mountain of pandemic-induced demand for connected devices proved to be an insurmountable challenge.
While we were highlighting how MKS’ as-reported metrics made investors miss the story, one can understand why the market has been apprehensive about the name.
After all, semiconductor equipment makers and manufacturers alike are perceived as lower return cyclical businesses. The capacity constraints and long cycle times that are still strangling the industry have further muddied the waters.
The depressed stock prices MKS and its peers have been seeing are a sign that these supply burdens outweigh the demand tailwinds in the eyes of most investors. Now that the price of silicon, a key raw component, has shot through the roof, the outlook has become even more uncertain.
Our own analysts are grappling with this very issue. The supply chain fog is making it exceedingly difficult to hold conviction on names exposed to chipmaking. Our team has only identified two names among the dozens of options that are compelling investments. You can read about them here on our Conviction Long List.
On the credit side though, the story couldn’t be more clear – but only if you’re looking at the right numbers. There is a particularly surprising disconnect between how ratings agencies perceive MKS’ debt and its real ability to repay its obligations.
MKS has $880 million in cash on hand, and $820 million in debt, none of which matures in the next 5 years. Moreover, its $8 billion market cap should give it ample opportunities to sustainably refinance that debt.
The company is rated by S&P, one of the major credit rating agencies, as a “BB” credit. That implies a 10% chance that it will default in the next 5 years. That is outrageous for a company whose net cash and market capitalization is ten times its debt load.
When we look at the company’s Credit Cash Flow Prime (“CCFP”), we see the absurdity of this rating.
In the chart below, the stacked bars represent the firm’s obligations each year for the next seven years. These obligations are then compared to the firm’s cash flow (blue line) as well as the cash on hand available at the beginning of each period (blue dots) and available cash and undrawn revolver (blue triangles).
Even when incorporating conservative cyclicality into earnings estimates for the future, CCFP shows that creditors should have no concerns about default risk. Take a look:
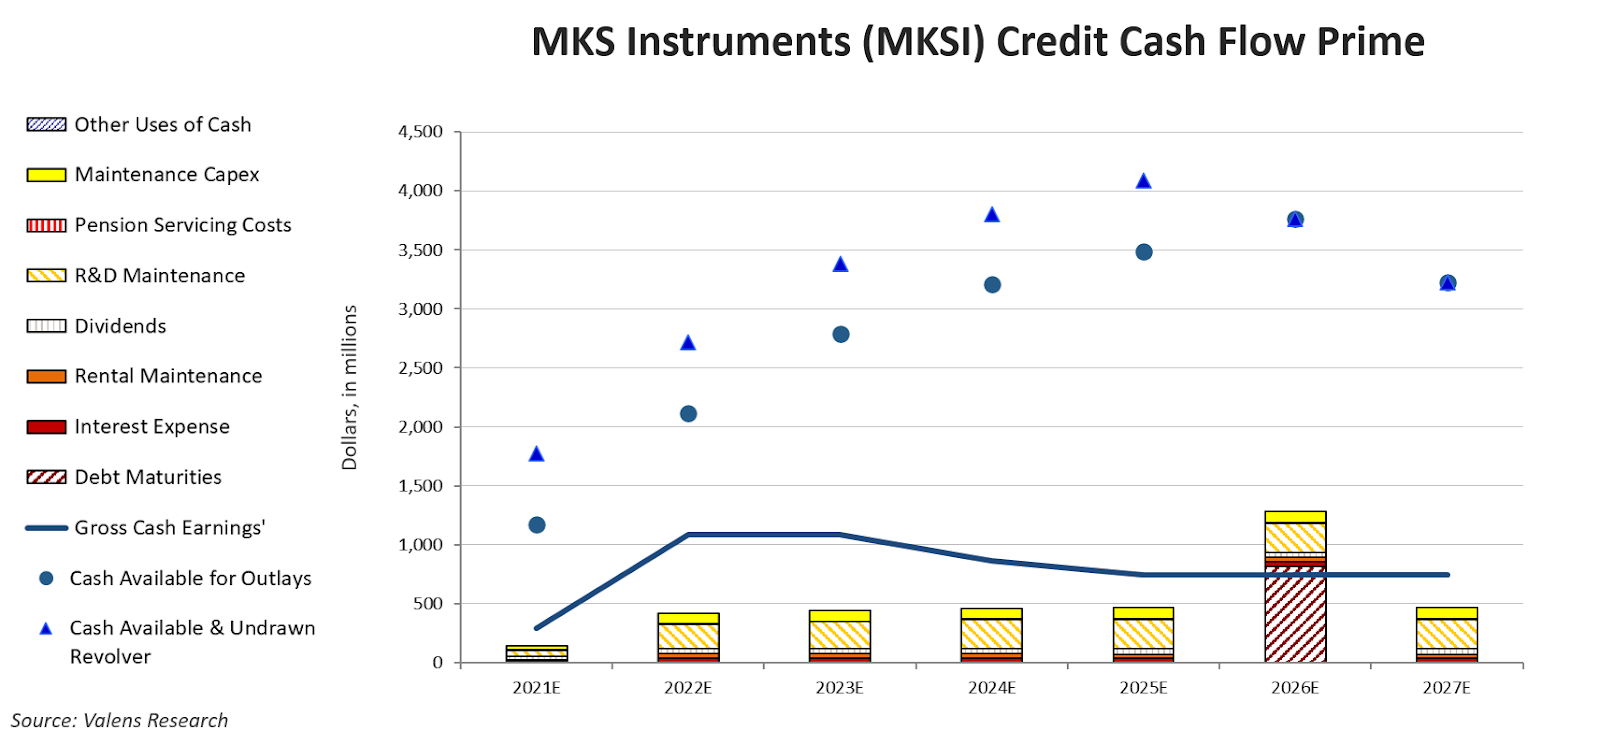
Hence, we view the company as an “IG3+” name, signaling safe credit to investors.
Dislocations in credit ratings are often followed by dislocations in credit yields. We are always looking for bonds with attractive risk-reward payoffs.
The Valens Conviction Credit List offers deep credit security analysis that identifies the best bonds in the corporate credit universe. Investors looking for a safe place to store their money for the next five or fewer years should look no further than the Conviction Credit List. Learn about how to get access here.
SUMMARY and MKS Instruments, Inc. Tearsheet
As the Uniform Accounting tearsheet for MKS Instruments, Inc. (MKSI:USA) highlights, the Uniform P/E trades at 14.6x, which is below the corporate average of 24.3x, but around its historical P/E of 13.8x.
Low P/Es require low EPS growth to sustain them. In the case of MKS, the company has recently shown a 41% Uniform EPS growth.
Wall Street analysts provide stock and valuation recommendations that in general provide very poor guidance or insight. However, Wall Street analysts’ near-term earnings forecasts tend to have relevant information.
We take Wall Street forecasts for GAAP earnings and convert them to Uniform earnings forecasts. When we do this, MKS’ Wall Street analyst-driven forecast is for 39% and 13% EPS growth in 2021 and 2022, respectively.
Based on the current stock market valuations, we can use earnings growth valuation metrics to back into the required growth rate to justify MKS’ $163 stock price. These are often referred to as market embedded expectations.
The company is currently being valued as if Uniform earnings were to shrink by 1% over the next three years. What Wall Street analysts expect for MKS’ earnings growth is above what the current stock market valuation requires in 2021 and 2022.
Furthermore, the company’s earning power in 2020 is 3x the long-run corporate average. Moreover, cash flows and cash on hand are 5x its total obligations—including debt maturities, capex maintenance, and dividends. Additionally, intrinsic credit risk is 60bps above the risk-free rate. All in all, this signals a low dividend and credit risk.
Lastly, MKS’ Uniform earnings growth is below peer averages, while the company is trading above its average peer valuations.
Best regards,
Joel Litman & Rob Spivey
Chief Investment Strategist &
Director of Research
at Valens Research