
Welcome to the Investor Essentials Daily from Valens Research

Thank you so much for having been a Valens Research Institutional Daily reader.
We’re excited to continue to bring you interesting, insightful, and still free essential investor insights, as we turn to the new year.
We’re streamlining how we deliver these insights with just a bit more structure.
Macro Mondays – We’ll highlight our macroeconomic “Chart of the Week” such as from the powerful Market Phase Cycle™ framework.
Tuesday Tearsheets & Embedded Expectations (or both) – The insightful individual company analysis you’ve gotten used to, diving into the market’s Embedded Expectations for future company performance along with a Uniform Accounting tearsheet showing just how different the true Uniform numbers are from as-reported GAAP and IFRS.
Wednesday Credit Insights – You can’t be a great equity investor or credit investor without being a solid credit analyst. We’ll reveal just how different and useful credit research can be when powered by Uniform Accounting for a specific company, and the fundamental company-specific story that makes them relevant, along with a tearsheet.
Thursday Tearsheets – Just like on Tuesdays, we’ll deliver another company’s unique UAFRS-based performance and valuation analysis.
Friday Portfolio Analytics – Examining and learning from the CURRENT portfolios of great investors–and major investment firms. We’ve received tremendous feedback on our deep dives into the portfolios of Seth Klarman at Baupost, Driehaus at Driehaus Capital, Julian Robertson and Chase Coleman’s Tiger Global, and Jean-Marie Eveillard at First Eagle. So we decided to make it a regular weekly thing. In addition to reviewing the portfolio, we’ll also dive into one of their major investment holdings with a UAFRS tearsheet.
We hope you will gain a lot from the new structure’s daily format. Obviously, if you have any feedback, let us know! We look forward to continuing to offer the insights you’ve been enjoying.
Now on to our company analyses for the day:
MKSI: MKS Instruments. What is the market pricing in?
Markets are pricing in expectations for Uniform ROA to fall, but management is confident about their memory segment, sales mix, and foundry business
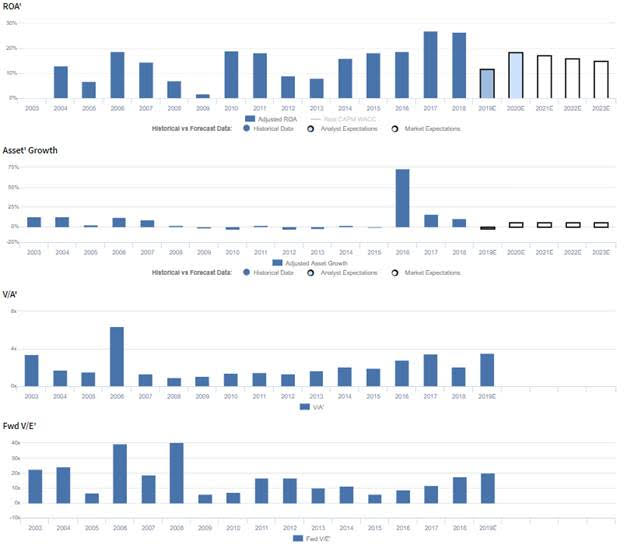
MKSI currently trades near corporate averages relative to UAFRS-based (Uniform) Earnings, with a 20.0x Uniform P/E. At these valuations, the market is pricing in expectations for Uniform ROA to fall from 26% in 2018 to 15% by 2023, accompanied by 5% Uniform Asset growth going forward.
Meanwhile, analysts have similar expectations, projecting Uniform ROA to fall to 19% by 2020, accompanied by 2% Uniform Asset shrinkage.
MKSI has historically seen somewhat cyclical profitability, with Uniform ROA improving from 13% in 2004 to 19% in 2006, before falling to lows of 2% in 2009. Subsequently, Uniform ROA expanded to 18%-19% levels in 2010-2011, fell back to 8% in 2013, and steadily improved to 26%-27% levels in 2017-2018. Meanwhile, Uniform Asset growth has been fairly robust, positive in 11 of the past 16 years, ranging from -3% to 16%, excluding 74% growth driven by the firm’s acquisition of Newport Corp.
MKSI Performance Drivers – Sales, Margins, and Turns

Cyclicality in Uniform ROA has been driven primarily by trends in Uniform Earnings Margin, and to a lesser extent, Uniform Asset Turns. Uniform Margins improved from 1% in 2003 to 16% in 2006, before declining back to 3% in 2009. Thereafter, Uniform Margins improved to 17% in 2011, before falling to 9% in 2013, and steadily improving to 23% in 2018. Meanwhile, Uniform Asset Turns rose from 0.7x in 2003 to 1.2x in 2006, before falling to 0.5x in 2009. Uniform Turns then sustained 0.9x-1.2x levels from 2010 to 2018. At current valuations, markets are pricing in expectations for a reversal in recent Uniform Margin improvements, coupled with stability in Uniform Turns.
MKSI Earnings Call Forensics
Valens’ qualitative analysis of the firm’s Q3 2019 earnings call highlights that management is confident they are well-positioned in memory when NAND comes back, and they are confident one of their largest customers has performed well in memory over the last several years. Furthermore, they are confident they benefited from their geographical sales mix and that their foundry business will be strong in Q4. That said, they may be concerned about their ability to meet their long-term product sales mix goal and sustain recent operating margin levels.
MKSI: UAFRS VS As-Reported. What is the real economic performance of the firm?
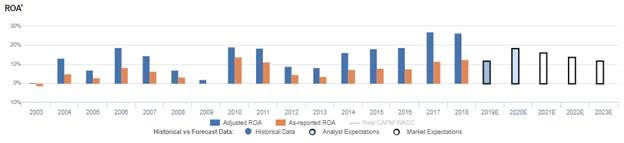
Uniform Accounting metrics also highlight a significantly different fundamental picture for MKSI than as-reported metrics reflect. As-reported metrics can lead investors to view a company to be dramatically stronger or weaker than real operating fundamentals highlight. Understanding where these distortions occur can help explain why market expectations for the company may be divergent.
As-reported metrics significantly understate MKSI’s ROA. For example, as-reported ROA for MKSI was 13% in 2018, substantially lower than Uniform ROA of 26%, making MKSI appear to be a much weaker business than real economic metrics highlight. Moreover, as-reported ROA has been substantially lower than Uniform ROA in each year since 2003, misleading investors to believe that MKSI has a much lower ROA floor than is accurate.
Broadcom: Today’s Tearsheet
Today’s tearsheet is for Broadcom. Broadcom trades in line with market average valuations. The company has recently had significantly negative -24% Uniform EPS growth. EPS growth is forecast to remain negative next year, at -21% in 2019, before inflecting strongly positive, to 31% in 2020. At current valuations, the market is pricing the company to see earnings shrink by 1% a year going forward.
The company’s earnings growth is forecast to be below peers in 2019, but the company is just trading at peer average valuations. That being said, the company has robust returns, and no cash flow risk to their dividend.
Best regards,
Joel Litman & Rob Spivey
Chief Investment Strategist &
Director of Research
at Valens Research