Taking a deeper dive into one of RMB Capital’s top holdings

In last week’s portfolio review, we highlighted portfolio manager Jeff Madden and his award-winning SMID Cap Fund (RMBMX) at RMB Capital.
We specifically talked about how the fund’s strategy—and success for that matter—is based in large part on restating as-reported financials to discover the true economic fundamentals of a company, something we also do here at Valens Research.
Today, we’ll examine one of the largest holdings of the fund and explain how the world’s best investors see companies differently using a Uniform Accounting framework.
Also below, the company’s Uniform Accounting Performance and Valuation Tearsheet.
Investor Essentials Daily:
Thursday Tearsheets
Powered by Valens Research
While we call it Uniform Accounting at Valens, at RMB Capital, the process of picking apart unreliable as-reported financials and applying the results to investment decision-making is known as the “Economic Return Framework.”
This investment philosophy is leveraged across all of the firm’s strategies, helping Jeffrey Madden and his team generate alpha.
The firm’s U.S. Alpha Equity Strategy for example employs the approach to identify high quality companies with long records of creating value and attractive valuations.
With a focus on the long-term, the fund adopts a perspective much like that of a business owner—concentrating primarily on the creation and preservation of wealth.
This allows clients to easily distinguish between short-term luck and genuine investment management skill over long periods of time.
As the table below illustrates, this framework has been tremendously successful, beating the Russell 3000 Index by nearly 3% annually since inception.
Last week we highlighted Madden’s SMID Cap Fund, and talked about how the portfolio as a whole unlocked value. To get a better idea of how a Uniform Accounting-style investment approach generates alpha, let’s take a look at one of his largest holdings.
Vail Resorts (MTN) owns and operates mountain resorts and ski areas across the globe, with locations ranging from British Columbia and the Rockies to New England and Australia.
Some of its leading Rocky Mountain resorts—such as Breckenridge, Park City, and Vail Mountain—are consistently among the most visited ski resorts in America every season.
Yet since 2016, Vail has gone on a major buying spree, expanding its operations from Colorado and Utah to include locations in Canada, Australia, the Pacific Northwest, New England, Pennsylvania, and the Midwest.
This has allowed the company to dramatically expand the range of offerings on its “Epic Pass” promotions—where skiers can purchase a single season pass that enables them to obtain lift access to all Vail Resort locations.
Much like a streaming-service provider obtaining new content to attract viewers, Vail’s acquisitions of new mountains and resorts has led to increasing pricing power and increasing profitability.
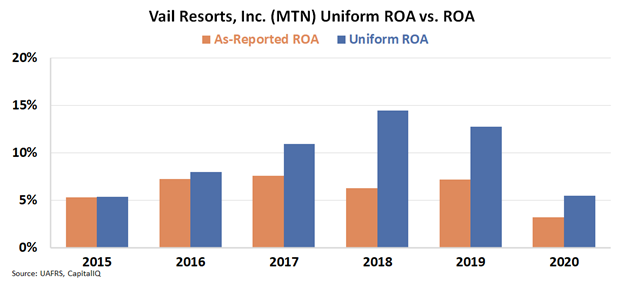
But just relying on as-reported financial metrics, investors would have hardly noticed the company’s improved performance.
Excluding the pandemic year in 2020, as-reported return on assets (ROA) have fluctuated between 5% and 7% over the past five years—barely above corporate averages for the cost of capital—making Vail appear to be a mediocre business.
However, by adjusting for accounting distortions inherent to as-reported financial metrics, one can see that over the same time period Uniform ROA advanced from 5% to 13%. Performance suffered in the pandemic, though, which was expected because of spacing restrictions.
This discrepancy illustrates the power of Uniform Accounting for investors like Jeffrey Madden—it allows them to assess the real economic fundamentals of a business and decide whether or not it is worth owning.
Without having access to the real numbers, investors would assume this strategy bore Vail no fruit. Instead, SMB was able to be among the first to see a business transformation, and invest behind it.
SUMMARY and Vail Resorts, Inc. Tearsheet
As the Uniform Accounting tearsheet for Vail Resorts, Inc. (MTN:USA) highlights, the Uniform P/E trades at 46.6x, which is above the global corporate average of 23.7x, but below its own historical average of 48.9x.
High P/Es require high EPS growth to sustain them. That said, in the case of Vail Resorts, the company has recently shown a 69% Uniform EPS decline.
Wall Street analysts provide stock and valuation recommendations that in general provide very poor guidance or insight. However, Wall Street analysts’ near-term earnings forecasts tend to have relevant information.
We take Wall Street forecasts for GAAP earnings and convert them to Uniform earnings forecasts. When we do this, Vail Resorts’ Wall Street analyst-driven forecast is a 2% EPS decline in 2021 and a 204% EPS growth in 2022.
Based on the current stock market valuations, we can use earnings growth valuation metrics to back into the required growth rate to justify Vail Resorts’ $309 stock price. These are often referred to as market embedded expectations.
The company is currently being valued as if Uniform earnings were to grow 35% annually over the next three years. What Wall Street analysts expect for Vail Resorts’ earnings growth is below what the current stock market valuation requires in 2021 but above that requirement in 2022.
Furthermore, the company’s earning power in 2021 is below the long-run corporate average. Cash flows and cash on hand are below its total obligations—including debt maturities, capex maintenance, and dividends. Intrinsic credit risk is also 160bps above the risk free rate. All in all, this signals moderate credit and dividend risk.
To conclude, Vail Resorts’ Uniform earnings growth is in line with its peer averages. Moreover, the company is trading above its average peer valuations.
Best regards,
Joel Litman & Rob Spivey
Chief Investment Strategist &
Director of Research
at Valens Research


