
Passive investing is about getting factor exposure, and UAFRS shows buying this “growth” fund provides exactly that

Many investors today do not have the time or resources to search for individual growth stocks to buy. This is why they invest in ETFs either exposed to a formulaic group of growth stocks across the entire market or a broad theme.
For these investors, getting exposure to a growth index eliminates the hassle of looking for these companies, for a minimal fee. However, are growth stock ETFs really giving investors exposure to growth companies? We are going to break the largest one down to find out.
In addition to examining the portfolio, we are including a deeper look into the fund’s largest current holding, providing you with the current Uniform Accounting Performance and Valuation Tearsheet for that company.
Investor Essentials Daily:
Friday Uniform Portfolio Analytics
Powered by Valens Research
Last week, we took a look at the S&P 500 Value Index (SVX) to understand if it truly represented the value companies investors were looking for.
As we mentioned in the article, the goal of these investment vehicles is to give investors exposure to specific factors they think may outperform the market. Factors are described as quantifiable characteristics that can explain differences in stock returns.
Instead of just buying into the S&P 500, investors can get stocks that just fit the criteria for a certain factor such as value or growth.
The problem is as-reported accounting can cloud the definition of such factors. When a company’s asset base or earnings are distorted, traditional metrics can make a stock appear to be value or growth, when in reality, it is not.
After analyzing last week’s portfolio, we concluded that investing in the S&P 500 Value Index was a way to buy mature, low growth, and high return companies at market average multiples, making it less compelling for investors looking for exposure to the “value” factor.
After the accounting noise was removed, we could see the fund had a market average V/E’ and wasn’t finding companies where the market had overly pessimistic earnings expectations.
The philosophy surrounding factor investing strategy comes from research done by Eugene Fama and Kenneth French in the 1990s, which we discussed in August.
They identified a model to help describe stock returns and helped launch the beginnings of numerous quant funds focusing on factor investing.
Value and growth were not among the original factors, but have since been added and used by many funds. That being said, as we mentioned last week, it is always good to check if a specific factor fund is actually giving investors exposure to said factor.
So this week, we are going to take a look at the S&P 500 Growth Index (SGX) to see whether investors are actually being exposed to the growth factor, unlike its value counterpart.
The S&P 500 Growth Index measures stocks using three factors which are sales growth, earnings change to price ratio, and momentum. Companies in this index should have strong returns, as their competitive moats allow them to grow much faster than competitors.
Despite the S&P 500 growth index’s focus on buying companies considered growth stocks, looking at the fund’s holdings paint a different picture. Using as-reported metrics, it appears the index is investing in low-return businesses.
Using Uniform Accounting, we can see if the companies in this index are actually stronger, higher growth names after the accounting noise is removed.
See for yourself below.
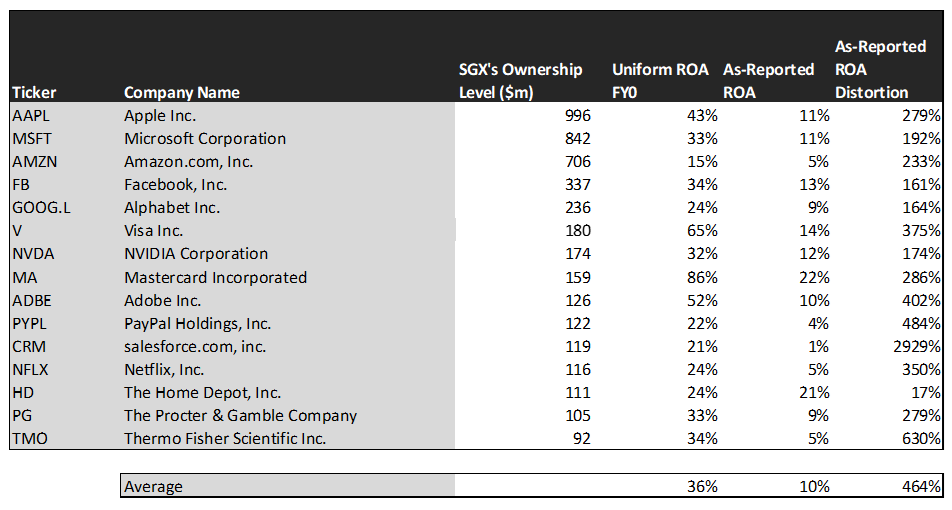
Looking at as-reported accounting, investors would think buying into the SGX ETF would lead to losing out on investment potential.
On an as-reported basis, many of these companies are slightly below average performers with returns at 10% or below, with the average as-reported return on assets (ROA) right around 10%.
In reality, the average company in the index displays an impressive average Uniform ROA of 36%.
Once we make Uniform Accounting (UAFRS) adjustments to accurately calculate earnings power, we can see the underlying strength of companies in the S&P 500 growth index.
Once the distortions from as-reported accounting are removed, we can see Salesforce (CRM) does not have a negligible return of 1%, but a sizable ROA of 21%.
Similarly, Thermo Fisher’s (TMO) ROA is really 34%, not at 5%. While as-reported metrics are portraying the company as near cost of capital, Uniform Accounting shows the company’s truly robust operations.
Netflix (NFLX) is another great example of as-reported metrics misrepresenting the company’s profitability. It doesn’t have a 5% ROA, it is actually at 24%.
The list goes on from there, for names ranging from Microsoft (MSFT) and Procter & Gamble (PG), to Facebook (FB) and Visa (V).
If investors were to only look at as-reported metrics, they would assume growth investing means accepting exposure to companies with average returns as the companies chase growth. In reality, these companies have huge returns.
Now, let us see how these firms’ are growth companies, with high EPS growth to see if the index is focusing on the companies it claims to be focusing on.
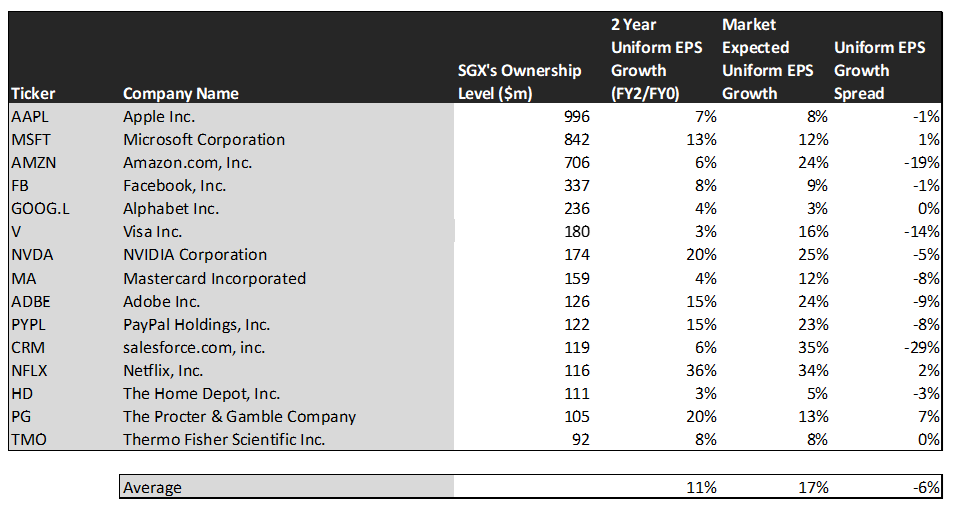
This chart shows three interesting data points:
- The 2-year Uniform EPS growth represents what Uniform earnings growth is forecast to be over the next two years. The EPS number used is the value of when we take consensus Wall Street estimates and we convert them to the Uniform Accounting framework.
- The market expected Uniform EPS growth is what the market thinks Uniform earnings growth is going to be for the next two years. Here, we show by how much the company needs to grow Uniform earnings in the next 2 years to justify the current stock price of the company. If you’ve been reading our daily analyses and reports for a while, you’ll be familiar with the term embedded expectations. This is the market’s embedded expectations for Uniform earnings growth.
- The Uniform EPS growth spread is the spread between how much the company’s Uniform earnings could grow if the Uniform earnings estimates are right, and what the market expects Uniform earnings growth to be.
The average company in the U.S. is forecast to have 5% annual Uniform Accounting earnings growth over the next 2 years. These stocks are forecast by analysts to have 11% growth.
This highlights that by buying these names, investors are buying companies with growth expectations well in excess of the market. That being said, as might be expected, the market is paying a premium for these names already.
One example of a company with high growth potential is Proctor and Gamble. While the market expects PG to grow 13% over the next two years, analysts forecast the firm to see 20% growth over the same period.
Another company with similar dislocations is Microsoft. The company is forecast for Uniform EPS to grow by 13% a year, while the market is expecting the company to only grow EPS by 12%.
That being said, many of these companies are forecast to have earnings growth less than market expectations. For these companies, like Amazon (AMZN), Visa, and Adobe (ADBE), the market has growth expectations in excess of analysts’ predictions.
In conclusion, these traditional growth stocks have high growth potential, and Uniform metrics show these firms have high returns as well.
Investors are correct in their belief that SGX looks like an easy way to get exposure to some of the most innovative and fast growing names in the S&P 500. These companies have returns well in excess of the market, and more importantly for these investors, have high growth forecasts.
SUMMARY and Apple Inc. Tearsheet
As S&P Growth’s largest individual stock holding, we’re highlighting Apple’s tearsheet today.
As the Uniform Accounting tearsheet for Apple highlights, the Uniform P/E trades at 27.8x, which is above global average valuation levels, as well as its historical valuations.
High P/Es require high EPS growth to sustain them. In the case of Apple, the company has recently shown a 2% Uniform EPS growth.
Wall Street analysts provide stock and valuation recommendations that in general provide very poor guidance or insight. However, Wall Street analysts’ near-term earnings forecasts tend to have relevant information.
We take Wall Street forecasts for GAAP earnings and convert them to Uniform earnings forecasts. When we do this, Apple’s Wall Street analyst-driven forecast is a 73% Uniform EPS shrinkage in 2020, then a 12% Uniform EPS growth in 2021.
Based on current stock market valuations, we can use earnings growth valuation metrics to back into the required growth rate to justify Apple’s $113 stock price. These are often referred to as market embedded expectations.
The company needs to grow its Uniform earnings by 11% each year over the next three years and to justify current stock prices. What Wall Street analysts expect for Apple’s earnings growth is below what the current stock market valuation requires in 2020 but above in 2021.
Furthermore, the company’s earning power is 7x the corporate average. Also, cash flows are 3x above their total obligations—including debt maturities, capex maintenance, and dividends. Together, this signals a low dividend risk.
To conclude, Apple’s Uniform earnings growth is way below peer averages in 2020, but trading way above average peer valuations.
Best regards,
Joel Litman & Rob Spivey
Chief Investment Strategist &
Director of Research
at Valens Research