Taking another look at a sleepy breakfast foods company

Those who read yesterday’s Investor Essentials Daily newsletter already know that breakfast food conglomerate Post Holdings is a victim of bad GAAP accounting standards.
But it’s not just equity investors who are misled. Let’s use our Credit Cash Flow Prime analysis to see how the major credit agencies are also missing the story.
Also below, the company’s Uniform Accounting Performance and Valuation Tearsheet.
Investor Essentials Daily:
Wednesday Credit Insights
Powered by Valens Research
Yesterday, we talked about how distorted as-reported metrics are for cereal company Post Holdings (POST).
Despite being a sleepy business far out of the limelight, its strategy of rolling up small ready-to-eat brands like Fruity Pebbles, Raisin Bran, and Honey Bunches of Oats has been incredibly accretive.
But if you looked only at their as-reported return on assets (ROA), you’d see a business that is losing value faster than creating it. By cleaning up the distortions in their financial statements, we can actually see that Post is a 20%-30% ROA business.
However, equity analysts aren’t the only ones looking at distorted numbers and misunderstanding companies’ business models.
Credit rating agencies, despite their size and prestige, are routinely falling victim to the same trap, and we understand why.
Getting to the bottom of distorted accounting is hard. We at Valens consider it our core competency, and have oriented the entire organization around this singular task. But behemoth rating companies like S&P and Moody’s are caught on pointless metrics and irrelevant data points, making their grading worthless.
So let’s see what the agencies say about Post Holdings.
Moody’s has assigned it a B1, and S&P a B+. This means they think there is a roughly one-in-four chance the company defaults from its debt load in the next five years.
We have built a tool to fact-check Moody’s and S&P. Unlike theirs, our system relies on Uniform accounting standards, which allow for true apples-to-apples comparisons between companies, hence allowing for a consistent and rule-based grading system with zero wiggle room.
That tool is the Credit Cash Flow Prime, or CCFP.
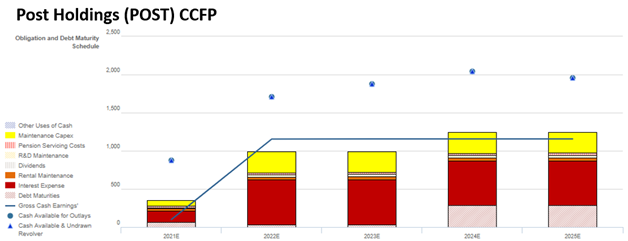
The blue dots represent the cash available to the company, while the blue line represents Uniform earnings. The bars represent the set of obligations the company must pay off in each subsequent year, with the most easily divertible obligations like maintenance capex stacked towards the top, and unbreakable contractual obligations like debt maturities sitting near the bottom.
Take a look:

A credit situation like Post’s isn’t one of a company with a 25% chance of defaulting on debt.
The first metric to look at when analyzing a firm’s debt profile is its cash flow buffer over operating expenses. In other words, we are trying to understand if the company is running a sustainable business model without needing to scoop into its cash reserves, which may have been bolstered by debt or other one-time benefits.
For each year after 2021, Post will have no problem using its year-to-year cash flows to pay for its operations.
Even when looking at the whole picture including debt maturities, we can see that the debt coming due in 2024 and 2025 should be of no concern to the company. Not only does Post have plenty of cash available to service its obligations, but it could probably pay the maturities off with its cash flows alone by deferring just a sliver of maintenance capex.
Hence, we rate Post as a cross-over name, with an XO- rating, rather than the high-yield, highly speculative ratings assigned to it by Moody’s and S&P.
To see our CCFP for over 25,000 companies, along with their Uniform ROA and other Uniform metrics going back 15 years, learn how to get access to our research app here.
SUMMARY and Post Holdings, Inc. Tearsheet
As the Uniform Accounting tearsheet for Post Holdings, Inc. (POST:USA) highlights, the Uniform P/E trades at 17.4x, which is below the global corporate average of 21.9x but around its own historical average of 16.6x.
Low P/Es require low EPS growth to sustain them. In the case of Post, the company has recently shown a 45% Uniform EPS decline.
Wall Street analysts provide stock and valuation recommendations that in general provide very poor guidance or insight. However, Wall Street analysts’ near-term earnings forecasts tend to have relevant information.
We take Wall Street forecasts for GAAP earnings and convert them to Uniform earnings forecasts. When we do this, Post’s Wall Street analyst-driven forecast is a 54% and 60% EPS growth in 2021 and 2022, respectively.
Based on the current stock market valuations, we can use earnings growth valuation metrics to back into the required growth rate to justify Post’s $111 stock price. These are often referred to as market embedded expectations.
The company is currently being valued as if Uniform earnings were to shrink by 1% over the next three years. What Wall Street analysts expect for Post Holdings’s earnings growth is above what the current stock market valuation requires through 2022.
Furthermore, the company’s earning power is 4x the long-run corporate average. Moreover, cash flows and cash on hand are above its total obligations—including debt maturities and capex maintenance. However, intrinsic credit risk is 210bps above the risk-free rate.
All in all, this signals moderate credit risk.
To conclude, Post’s Uniform earnings growth is above its peer averages and the company is trading below peer valuations.
Best regards,
Joel Litman & Rob Spivey
Chief Investment Strategist &
Director of Research
at Valens Research


