
Solar tailwinds are at an all time high, yet this ETF has lost ground this year. Here’s why…

The Biden administration is cracking down on solar products produced in China under dubious conditions.
Today’s ETF is heavily invested in a number of those companies. Let’s review the tailwinds and risks that are driving the solar business, and take a look at the ETF’s top holdings using our portfolio audit process.
In addition to examining the portfolio, we’re including a deeper look into the fund’s largest current holding, providing you with the current Uniform Accounting Performance and Valuation Tearsheet for that company.
Investor Essentials Daily:
Friday Uniform Portfolio Analytics
Powered by Valens Research
Three weeks ago, we highlighted the iShares Global Clean Energy ETF (ICLN).
In case you missed it, we found the fund’s largest holdings to be fairly expensive, with valuations already pricing in rapid future improvements in profitability and growth.
For many hopeful green energy investors, our analysis may have brought some tough news. However, ICLN is not an entirely fair representation of green energy investing overall. It is weighted towards the largest green energy producers and technology providers, with no specific vertical focus.
The green energy revolution is still in its infancy. Most industry analysts agree that the most crucial technical developments are yet to come. And the behemoths tracked by ICLN may not be the ones to bring that technology to the table.
Said otherwise, investors have other options.
One of these options is to narrow the focus to a specific green technology, and pick the winners within. Invesco has chosen this strategy for its solar ETF, TAN.
Given all of the attention to reaching carbon neutral, it shouldn’t be surprising that solar power companies have been doing well. TAN shot up from $25 in April 2020 to $125 by January 2021, an even more meteoric rise than what ICLN had experienced over the same period.
However, since then, the Biden administration has started to talk about how not all solar panels are created equal, and they may be pushing back against Chinese imports for various reasons.
One of these reasons is the Chinese government’s use of forced labor to compete with American products. John Kerry even called Chinese solar products “slavery panels” and halted all imports of Chinese solar goods.
TAN tracks a number of affected Chinese solar companies. Since its January highs, the ETF has been down by 30%.
Investors are left thinking about how to weigh the short-term headwinds with the long-term tailwinds. Of the latter, there are many.
Unlike ICLN, TAN has mostly excluded power generation companies. This is to the benefit of investors because the solar fields are far less profitable and have much less runway than the companies that supply them.
Between the firms that sell the polysilicon for the photovoltaic panels, to those that sell the DC inverter systems that allow homes to access the electricity generated by rooftop solar panels, there is a rapidly growing ecosystem behind the solar market. There is a lot of money to be made by unlocking efficiency gains or new solar viability by bringing the overall cost down.
Solar power naysayers have already started to realize it may be less of a question of if, and more so of when solar becomes significantly more economical than fossil fuels.
The technology gains over the past decade have been astounding. While the 25% solar cell efficiency improvement has been impressive, it pales in comparison to the 3x-4x reduction in total solar installation cost, driven by the falling price of panels.
However, the most challenging aspect for solar generation is not the economics of panels themselves, but their inability to match their output to the immediate energy demand.
Fossil fuel installations are great at this because they can at any point simply burn more fuel to push more electricity and match demand. Solar panels are at the mercy of the time of day and the clouds in the sky. That is why the whole industry hinges on batteries.
Batteries have the ability to make the excess energy generated during peak daylight hours available when the sun isn’t shining.
On the household side, battery products like the Tesla (TSLA) Powerwall can already go a long way to increasing the viability of solar panels. But at the industrial grid scale, the best solution so far has been to simply combine many small batteries into massive battery installations.
The cost of lithium-ion batteries, which power electric vehicles and most electronics, has fallen by a factor of four over the past five years, enabling these massive installations. Some are large enough to replace small- to medium-sized gas plants in high-value regions like California. But the approach is still too expensive and inefficient to facilitate totally solar-dependent power grids for the majority of the country.
New technologies on the way, such as solid state batteries on the consumer side and molten sodium liquid batteries on the industrial side are key to unlocking the solar future.
This all goes to say that the future of solar rests on technologies that have not yet been fully developed. This presents a massive opportunity to investors, who have been generous and excited to fund the research and development.
With strong funds flow, regulatory backing, and social support, the industry is riding on very powerful tailwinds. Let’s use Uniform accounting to dig into the top holdings of TAN. These insights may help investors better understand how the solar business compares to the broader clean energy sector.
Take a look at the top fifteen holdings of TAN:
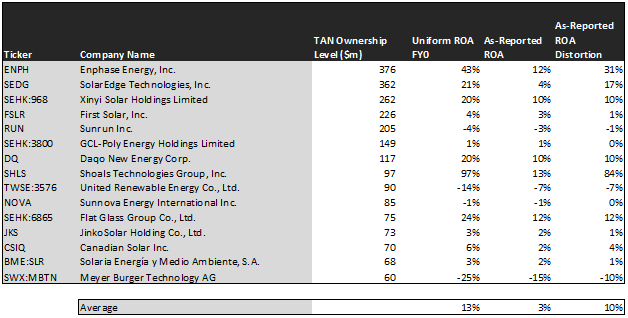
Most investors would see a portfolio full of companies returning below the cost of capital, with an average return on assets (ROA) of 3%.
But our audit uses Uniform Accounting standards, which corrects over a hundred distortions inherent to both the Generally Accepted Accounting Principles (GAAP) and the International Financial Reporting Standards (IFRS). Distortions in both frameworks make it impossible for investors to compare companies to each other on an apples-to-apples basis.
Valens developed Uniform Accounting to apply one set of rules to every company, eliminating hours of research for investors trying to make educated decisions about companies.
The companies in TAN don’t have an average ROA of 3%, but actually 13%, slightly above the U.S. average return of 12%.
For example, the fund’s largest holding, Enphase Energy (ENPH), doesn’t have an ROA of 12%. It actually demonstrates robust profitability with a 43% Uniform ROA, driven by its groundbreaking work on microinverters and its recent margins expansion.
Similarly, Daqo New Energy Corp (DQ) is not a 10% ROA business as it reports, but actually double that at 20%. Despite being a Chinese company and experiencing significant pressure from the Biden administration, Daqo sells crucial materials to solar panel manufacturers, and experienced a major lift in ROA last year.
However, just identifying companies with strong productivity is not enough to generate alpha. Investors need to also find the companies that the market is underpricing and underappreciating.
This is why we have developed our embedded expectations framework, which quickly and succinctly summarizes the degree to which markets are already pricing in future outperformance.

This chart shows three interesting data points:
– The first datapoint is what Uniform earnings growth is forecast to be over the next two years, when we take consensus Wall Street estimates and we convert them to the Uniform Accounting framework. This represents the Uniform earnings growth the company is likely to have, the next two years.
– The second datapoint is what the market thinks Uniform earnings growth is going to be for the next two years. Here, we are showing how much the company needs to grow Uniform earnings in the next 2 years to justify the current stock price of the company. If you’ve been reading our daily and our reports for a while, you’ll be familiar with the term embedded expectations. This is the market’s embedded expectations for Uniform earnings growth.
– The final datapoint is the spread between how much the company’s Uniform earnings could grow if the Uniform Accounting adjusted earnings estimates are right, and what the market expects Uniform earnings growth to be.
The embedded expectations analysis of TAN unfortunately lines up with that of ICLN: The market is generally expecting more from these companies than analysts do.
While the analysts, who work every day to understand market conditions and management initiatives, believe that these companies will grow their earnings by 26% over the next two years, the market is pricing them to grow their earnings by 53%.
For example, while analysts forecast First Solar (FSLR) to shrink its earnings by 7%, the market is expecting it to grow earnings by 16%. Should the analyst’s forecasts come to pass, the market may be disappointed causing the FSLR equity value to drop.
There are several companies on this list that share this story, including Sunnova Energy International Inc. (NOVA), United Renewable Energy Co., Ltd. (TWSE:3576), GCL-Poly Energy Holdings Limited (SEHK:3800), and Flat Grass Group (SEHK:6865).
One exception, however, is the aforementioned Daqo New Energy Corp. While analysts expect it to double its earnings over the next two years, the market is pricing it to stay flat. As always, investors need to do their own due diligence to understand exactly why analysts are expecting Uniform ROA to triple above historical highs in 2021 and 2022. If the reasons are valid, the company could have significant upside.
So where does this leave us?
TAN is a mixed bag. It is a portfolio of strong companies developing crucial technology for the next phase of the renewable energy transformation. But the market seems to already understand this. These stocks have been bid up to a point where even if the companies make good on their promises, their equity values might not move as much as investors hope.
This story is one we commonly observe through our research. The market is generally intelligent and is generally pricing companies to their full potential, if not even more.
But our process allows us to find those few companies that are under-appreciated. Our QGV-50 list, which finds the 50 best companies based on their quality, growth, and valuations, has historically beaten the market specifically because we identify the companies that the market has yet to figure out.
Learn how to get access to the QGV 50 here.
SUMMARY and Enphase Energy, Inc. Tearsheet
As TAN’s largest individual stock holdings, we’re highlighting Enphase Energy, Inc.’s tearsheet today.
As our Uniform Accounting tearsheet for Enphase Energy, Inc. (ENPH:USA) highlights, its Uniform P/E trades at 103.6x, which is above the global corporate average of 21.9x and its own historical average of 67.3x.
High P/Es require high EPS growth to sustain them. In the case of Enphase Energy, the company has recently shown a 9% Uniform EPS growth.
While Wall Street stock recommendations and valuations poorly track reality, Wall Street analysts have a strong grasp on near-term financial forecasts like revenue and earnings.
As such, we use Wall Street GAAP earnings estimates as a starting point for our Uniform earnings forecasts. When we do this, Enphase Energy’s Wall Street analyst-driven forecast is an EPS growth of 11% and 88% in 2021 and 2022, respectively.
Based on current stock market valuations, we can back into the required earnings growth rate that would justify Enphase Energy’s $175 stock price. These are often referred to as market embedded expectations.
What Wall Street analysts expect for Enphase Energy’s earnings growth is below what the current stock market valuation requires in 2021, but above that requirement in 2022.
The company’s earnings power is 7x corporate averages. Additionally, cash flows are 7x their total obligations—including debt maturities, capex maintenance, and dividends. Together, this signals low credit and dividend risk.
To conclude, Enphase Energy’s Uniform earnings growth is above peer averages, and thus is trading above its average peer valuations as well.
Best regards,
Joel Litman & Rob Spivey
Chief Investment Strategist &
Director of Research
at Valens Research