
Good Incentives Dictate Good Behavior, Bad Execution Dictates a Falling Stock Price – This Company May be an Example of Both

Each year, we spend several weekends teaching classes in MBA programs across the US, and sometimes globally. One of the two main classes we teach is on Return Driven Strategy, or RDS.
RDS is a course focused not on picking stocks, but understanding what makes great companies great.
One of the most important datapoints we require students to look at when analyzing a company is to understand how management is compensated.
Not how much they’re paid. That’s actually less important to us than what they’re paid to do.
There are generally 3 pieces of management compensation:
- Base Salary – The cash compensation management receives to show up and run the business, just like anyone who has a job
- Short-Term Incentive Compensation – This is the annual bonus that management is paid, generally in cash. It is almost always tied to some financial or other performance metric that management needs to deliver against
- Long-Term Incentive Compensation – This is the multi-year bonus that management is paid, generally in some form of equity compensation, be it stock options, restricted share units (RSUs) or something else. This is generally tied to either some financial or performance metric, or it is tied to the company’s stock performance or total shareholder return (TSR)
If you understand what management’s compensation is powered by, how they are incentivized, you can understand what management will try to do at the company, their likely behavior. Thus, Incentives Dictate Behavior.
Before we add any company to our Conviction Long Idea list, this is a required datapoint we have to review. We avoid companies where management’s incentives might lead them to make decisions that won’t create value.
Stanley Black and Decker (SWK) is a great example of a strong compensation framework.
Short-term incentive compensation is based on:
- EPS (50%)
- Free Cash Flow Conversion (25%) – this represents how much of the company’s earnings actually flow through to the real cash flow of the business
- Organic sales growth (25%) – Organic meaning excluding any acquired sales growth, so management has to grow the core business
Long-term incentive compensation is based on:
- Cash Flow Return on Investment (CFROI) – an adjusted accounting metric similar to Valens’ ROA’, which represents the real cash earning power of a business
- EPS
- TSR versus their peer group
This compensation framework drives management to improve all three of their value drivers, meaning sales growth, margins, and asset utilization.
EPS-based compensation will drive management to focus on improving margins, and also will slightly focus them on revenue growth.
Free cash flow conversion and CFROI metrics will focus management on both margin expansion and also greater efficiency in their investments in the business, attempting to unlock cash flow.
Lastly, sales growth compensation means they won’t focus on improving those metrics by shrinking the business, which doesn’t create as much value for shareholders, but will instead be attempting to drive growth while also improving their returns.
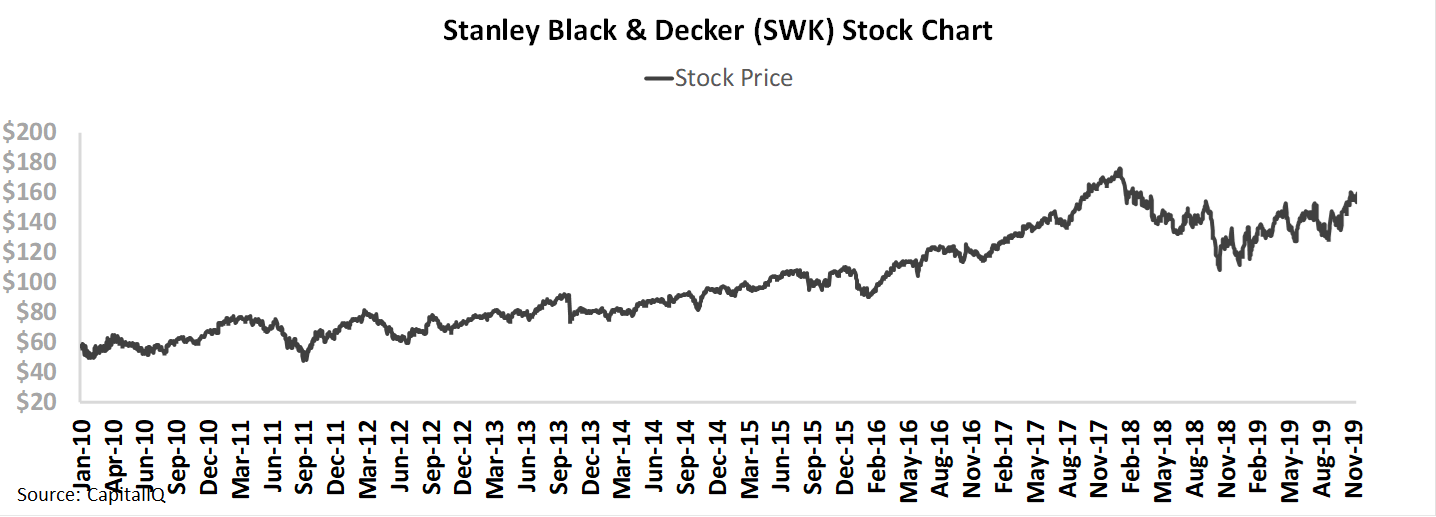
Thanks to this compensation framework, and the company’s strong execution ever since Black & Decker and Stanley merged in 2010, the company’s stock price has basically tripled.
However, strong compensation alone isn’t enough if management cannot execute on the strategies their incentives lead them to pursue.
When we’re analyzing earnings calls using our Earnings Call Forensics framework, one of the biggest signals that either gives us confidence or pause about a company, is when a company generates either Highly Confident/Excitement markers, or Highly Questionable markers about their compensation metrics.
This can be a strong signal that management is either locked in and executing well, or that they’re concerned about their bonuses, which are likely top of mind when they’re looking at their most important metrics.
While Stanley Black & Decker has executed well the past 10 years, in their most recent earnings call, we saw some reasons for concern. The market is pricing Stanley to keep on executing well going forward, but management appears to be concerned about growth, and about their EPS, two key compensation metrics. They may be spooked about their ability to hit their bonus targets, and with the market pricing the company for strong execution, there may be downside risk for the stock.
Want to See the Stocks We Recommend That Have Great Alignment and are Executing Well?
As we mentioned, on our Conviction Long Idea List, we specifically review Incentives Dictate Behavior analysis to make sure management teams are aligned in the right way, before we highlight an interesting name.
Right now we have a limited time offer for access to our Conviction Long Idea list, our best equity ideas. You can receive it and our Market Phase Cycle macro report as a special holiday bundle, at a low price we’ve never offered before.
You can hear more about the offer in the link above, or by clicking here.
Market expectations are for Uniform ROA to improve, but management may be concerned about their growth, EPS, and market share
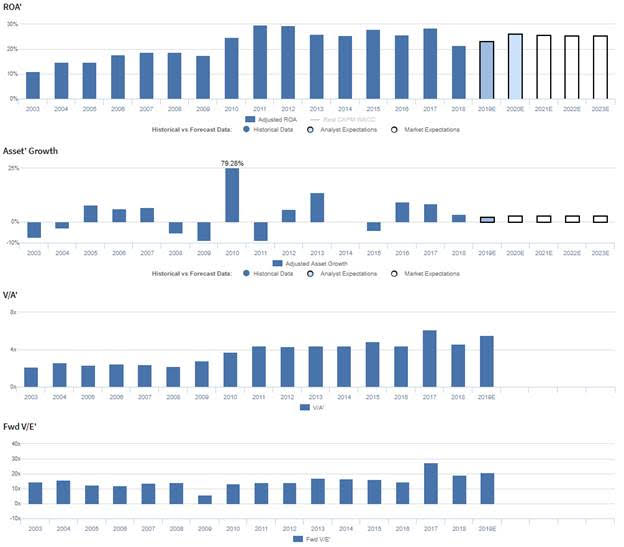
SWK currently trades near historical averages relative to UAFRS-based (Uniform) Earnings, with a 21.3x Uniform P/E. At these levels, the market is pricing in expectations for Uniform ROA to improve from 21% in 2018 to 26% by 2023, accompanied by 3% Uniform Asset growth going forward.
Meanwhile, analysts have similar expectations, projecting Uniform ROA to improve to 26% through 2020, accompanied by 2% Uniform Asset growth.
SWK has seen expanding profitability since their 2010 merger with Black & Decker. After improving from 11% in 2003 to a peak of 30% in 2011-2012, Uniform ROA ranged from 26%-29% through 2017, before fading to 21% in 2018. Meanwhile, Uniform Asset growth has been volatile, positive in nine of the past 16 years, while ranging from -9% to 14% since 2003, excluding 79% growth in 2010 due to the aforementioned merger.
Performance Drivers – Sales, Margins, and Turns
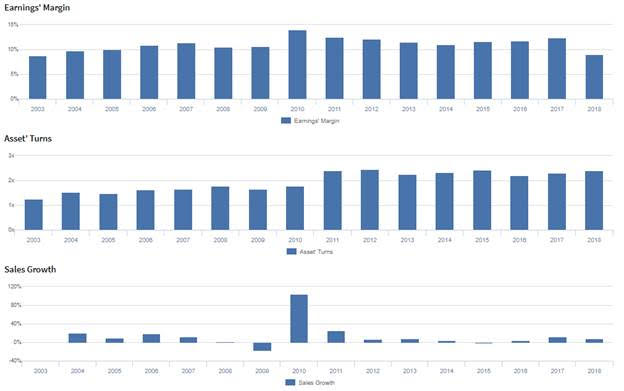
Expansion in Uniform ROA has been driven by trends in both Uniform Asset Turns and Uniform Earnings Margin. Uniform Turns expanded from 1.3x in 2003 to 2.2x-2.4x from 2011 through 2018. Meanwhile, Uniform Margins expanded from 9% in 2003 to 14% in 2010, before fading to 11% in 2014. Thereafter, Uniform Margins recovered to 12% in 2017, before falling back to 9% levels in 2018. At current valuations, markets are pricing in expectations for Uniform Margins to recover while Uniform Turns remain stable.
Earnings Call Forensics
Valens’ qualitative analysis of the firm’s Q3 2019 earnings call highlights that management is confident their effective tax rate will be approximately 16.5%, and they are confident they have successfully improved their margins. However, they may lack confidence in their ability to sustain double digit growth in the Craftsman brand and in their ability to realize $200 million in savings from their cost reduction measures. Furthermore, they may be concerned about the sustainability of recent volume growth within health care, automatic doors, and electronic security, and they appear concerned about ongoing margin headwinds through the remainder of 2019. Finally, they may lack confidence in their ability to sustain market share growth in South America and Southeast Asia, and they may lack confidence in their ability to improve their EPS.
UAFRS VS As-Reported
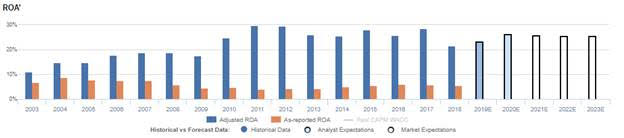
Uniform Accounting metrics also highlight a significantly different fundamental picture for SWK than as-reported metrics reflect. As-reported metrics can lead investors to view a company to be dramatically stronger or weaker than real operating fundamentals highlight. Understanding where these distortions occur can help explain why market expectations for the company may be divergent.
As-reported metrics significantly understate SWK’s profitability. For example, as-reported ROA for SWK was 6% in 2018, materially lower than Uniform ROA of 21% that year, making SWK appear to be a much weaker business than real economic metrics highlight. Moreover, since 2009, as-reported ROA has been less than a third of Uniform ROA, distorting the market’s perception of the firm’s profitability ceiling for over a decade.
Today’s Tearsheet
Today’s tearsheet is for Abbvie. Abbvie trades at significantly below market average valuations. The company has recently had robust 34% Uniform EPS growth. EPS growth is forecast to flip to -8% in 2019, before rebounding to 20% in 2020. At current valuations, the market is pricing the company to see earnings shrink by double digit rates going forward.
The company’s earnings growth is forecast to be below peers in 2019, but company is trading at peer average valuations. The company has robust returns, and no risk to their sizable dividend payments.
Regards,
Joel Litman
Chief Investment Strategist