
The pandemic has wreaked havoc on most quant funds, but this asset manager continues to find winners

Quantitative investing models can only go so far. They are limited to the data they have access to, which they use to predict future trends. When unexpected events occur, like the pandemic, it can throw these models for a loop.
Today’s fund is run by one of the most famous quant investors of all time. The fund uses factors to identify groups of stocks that will outperform over time.
In addition to examining the portfolio, we’re including a deeper look into the fund’s largest current holding, providing you with the current Uniform Accounting Performance and Valuation Tearsheet for that company.
Investor Essentials Daily:
Friday Uniform Portfolio Analytics
Powered by Valens Research
As this Economist article highlights, 2020 has been a poor year for quant investors. Almost every quant strategy has struggled.
Part of the reason has been that quant strategies use historical patterns to try and predict future results. Quants sift through huge amounts of data and use computer programs to identify factors that should outperform based on historical data.
However, 2020 has thrown these models for a loop. The coronavirus pandemic has been truly unprecedented and has created massive market volatility, sector splicing, and a widening disconnect between the market and the broader economy. In March, the market saw double-digit percentage gains and losses almost daily.
Pandemic news is not something these models have ever accounted for. One of the best performing quant strategies this year, momentum, saw huge losses when positive vaccine news was announced.
As most of the market ripped higher, momentum was stuck holding stocks that were benefitting from the coronavirus. These quant models were unable to forecast these events that have no historical precedent.
In addition to the pandemic, some longer-term patterns have lagged over the last few years. This includes the value factor, which has seen significant underperformance during the recent bull market following the great recession.
We have talked about the underperformance of these factors in the past when discussing Cliff Asness and his AQR fund.
One potentially large reason for this lag might be connected to some of the research we have done here at Valens. As-reported accounting no longer reflects operating reality, and the market understands this.
The below chart shows a quantitative portfolio of our own, using our historical Uniform Accounting database.
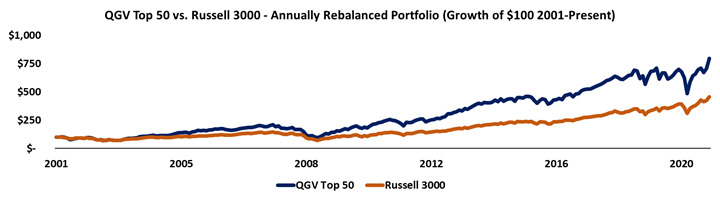
The Quality, Growth, and Value (QGV) 50 is a quantitative approach to picking stocks using Uniform Accounting. It looks for names with high growth, high returns, and low valuations.
Over the past 20 years, the QGV 50 has significantly outperformed the broader market. We recently launched the QGV 50 as a new product for investors to take advantage of these factors, which you can subscribe to here.
Some quant investors are lagging the market due to their use of inaccurate as-reported data. By using a simple Uniform Accounting quantitative approach, investors can see significantly stronger returns.
We wanted to take another look at AQR’s portfolio again in the context of high volatility to see if AQR is identifying the right names with their quant models.
Taking a look at its holdings using as-reported accounting, it appears as though the pandemic has thrown off its algorithms into investing in low-return businesses.
However, when applying the Uniform Accounting framework, we can see AQR is actually identifying a lot of the right names and businesses with high returns.
See for yourself below.
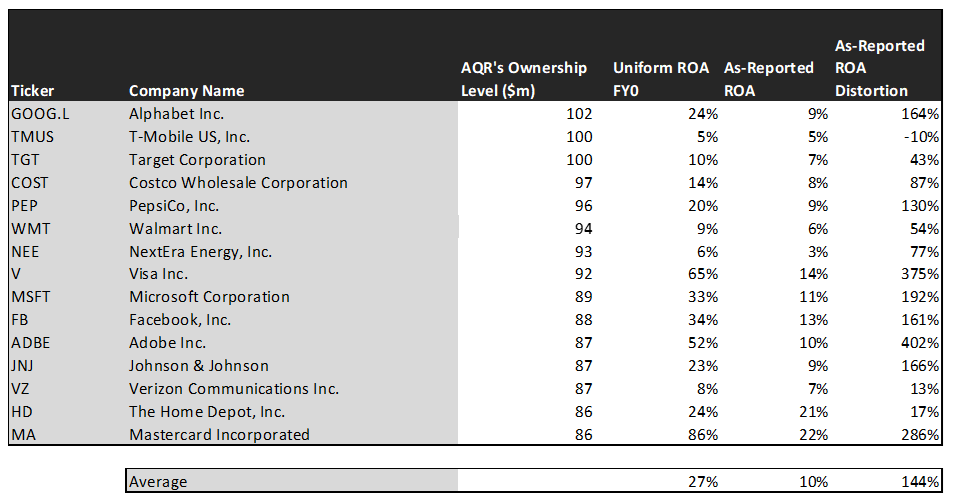
On an as-reported basis, many of these companies are poor performers with returns below corporate averages of 12%, with the average as-reported return on assets (ROA) right around 10%.
In reality, the average company in the index displays an impressive average Uniform ROA of 27%.
Once we make Uniform Accounting (UAFRS) adjustments to accurately calculate earnings power, we can see the underlying strength of the portfolio.
Once the distortions from as-reported accounting are removed, we can see Mastercard (MA) does not have a return of 22%, but a sizable ROA of 86%.
Similarly, Visa’s (V) ROA is really 65%, not at 14%. While as-reported metrics are portraying the company as a slightly above-average business, Uniform Accounting shows the company’s truly robust profitability.
The list goes on from there, for names ranging from Adobe (ADBE) and Facebook (FB), to Microsoft (MSFT).
If investors were to only look at as-reported metrics, they would assume AQR is investing in average and low-quality businesses.
Now, let us see how these firms’ returns can strengthen over time through EPS growth.
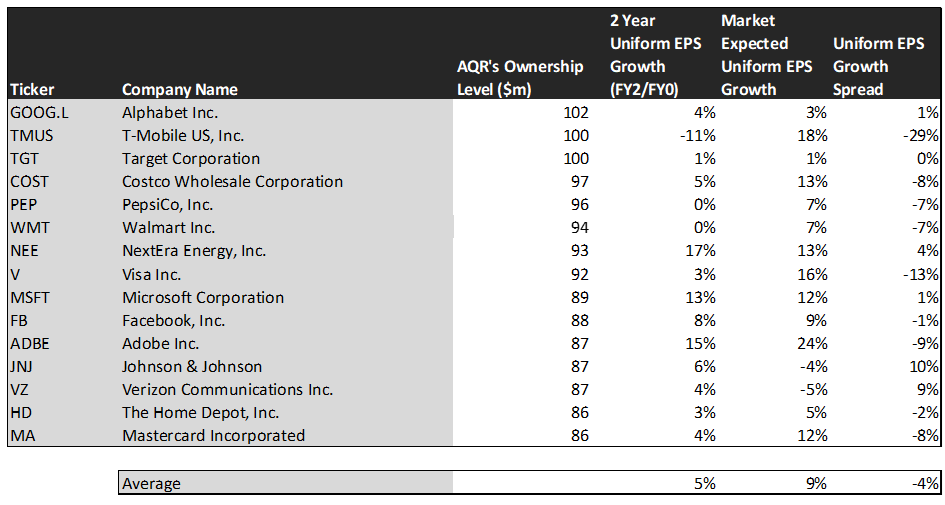
This chart shows three interesting data points:
- The 2-year Uniform EPS growth represents what Uniform earnings growth is forecast to be over the next two years. The EPS number used is the value of when we take consensus Wall Street estimates and we convert them to the Uniform Accounting framework.
- The market expected Uniform EPS growth is what the market thinks Uniform earnings growth is going to be for the next two years. Here, we show by how much the company needs to grow Uniform earnings in the next 2 years to justify the current stock price of the company. If you’ve been reading our daily analyses and reports for a while, you’ll be familiar with the term embedded expectations. This is the market’s embedded expectations for Uniform earnings growth.
- The Uniform EPS growth spread is the spread between how much the company’s Uniform earnings could grow if the Uniform earnings estimates are right, and what the market expects Uniform earnings growth to be.
The average company in the U.S. is forecast to have 5% annual Uniform Accounting earnings growth over the next 2 years. In comparison, these top stocks are forecasted similarly by analysts for 5% Uniform earnings growth.
On average, the market is pricing these companies to grow earnings by 9% a year. Analyst’s projections are slightly behind the market’s expectations.
One example of a company with high growth potential is Johnson & Johnson (JNJ). While the market expects Johnson & Johnson to shrink by 4% over the next two years, analysts forecast the firm to see 6% growth over the same period.
Another example is Verizon Communications (VZ). The company is cheap, as it is priced for Uniform earnings to shrink by 5%, but the company is forecasted to in fact grow its EPS by 4% in the next two years.
That being said, there are many companies forecast to have earnings growth less than market expectations. For these companies, like T-Mobile (TMUS), Visa, and Costco (COST), the market has growth expectations in excess of analysts’ predictions.
When looking at AQR’s holdings through the lens of Uniform Accounting, we can see the strength of their picks. The volatility in the market has not thrown AQR’s signals off as they clearly are still identifying high return businesses.
SUMMARY and Alphabet Incorporated Tearsheet
As AQR’s largest individual stock holdings, we’re highlighting Alphabet Incorporated’s (GOOG.L:USA) tearsheet today.
As the Uniform Accounting tearsheet for Alphabet highlights, their Uniform P/E trades at 24.2x, which is around global average valuation levels but above its historical average valuations.
Moderate P/Es require moderate EPS growth to sustain them. In the case of Alphabet, the company has recently shown an 18% Uniform EPS growth.
Wall Street analysts provide stock and valuation recommendations that in general provide very poor guidance or insight. However, Wall Street analysts’ near-term earnings forecasts tend to have relevant information.
We take Wall Street forecasts for GAAP earnings and convert them to Uniform earnings forecasts. When we do this, Alphabet’s Wall Street analyst-driven forecast is a Uniform EPS growth of 6% in 2020 and 12% in 2021.
Based on current stock market valuations, we can use earnings growth valuation metrics to back into the required growth rate to justify Alphabet’s $1,823 stock price. These are often referred to as market embedded expectations.
The company would need to grow its Uniform earnings by 7% each year over the next three years to justify their current valuation. What Wall Street analysts expect for Alphabet’s earnings growth is slightly below what the current stock market valuation requires in 2020, but above that requirement in 2021.
Furthermore, the company’s earning power is 4x the corporate average. Also, cash flows are also almost 5x higher than its total obligations. That said, intrinsic credit risk is only 20bps above the risk free rate. Together, this signals low credit and dividend risk.
To conclude, Alphabet’s Uniform earnings growth will continue to be above its peer averages in 2020, and is trading below average peer valuations.
Best regards,
Joel Litman & Rob Spivey
Chief Investment Strategist &
Director of Research
at Valens Research