
This hedge fund took in the largest return for its clients in 2020 at $10.5 billion

In April 2020, we looked at one of the most successful hedge fund managers who helped create the hedge fund industry.
Julian Robertson’s unique investment philosophy gave birth to a new generation of hedge fund managers, often called the “tiger cubs.”
Investor Essentials Daily:
Friday Uniform Portfolio Analytics
Powered by Valens Research
Just last week, Bloomberg reported that Tiger Global, one of the tiger cub funds, was the top performing hedge fund in 2020. It managed to generate $10.4 billion for its clients in a year with volatility, uncertainty, and unprecedented market conditions.
While we highlighted Tiger Global back in April, it’s worth seeing how the fund has adapted its portfolio through the end of the year to understand what the top managers are seeing in the markets.
In March 2000, Julian Robertson made the decision to return all Tiger Management’s investors’ money and shut down the hedge fund.
One of Tiger’s funds, the Jaguar Fund, had dropped 14% in the first 2 months of the year, having lost almost 18% since late 1998. After a $2 billion loss on a bad bet in the Japanese yen in 1998, Tiger had steadily seen investors leaving, and had taken on losses, seeing the firm’s AUM drop from $20 billion in 1998 to $6.5 billion at the time Robertson decided to close the doors.
Robertson and Tiger had been one of the early stars of the hedge fund world. He took $8 million in capital in 1980 and turned it into over $20 billion by the fund’s 1998 peak.
But Robertson was too early to the party of shorting internet stocks. His dogmatic value based philosophy on investing led him to be long old-economy companies in the late 1990s, in the face of a rampant growth-focused bull market.
It meant that when he reached his peak in AUM, it was just when he started losing money. And because of that timing, many have said he actually lost more money for investors than he ever made them in the prior 18 years.
Ironically, March 2000, when Tiger threw in the towel, was the market peak, and Robertson ended up being proven right.
He made plenty of money after 2000, as he remained short the internet bubble with his own money, but his investors never got to participate.
But that’s not the most important thing that came out of Tiger Management. The most important thing was the group of investors that Robertson mentored and sponsored at Tiger growing after its demise.
He had built an all-star team at Tiger. They matured under him, absorbing his deep fundamental research perspective.
Importantly, with his help, they also learned his mistakes in the dot.com bubble, and understood the importance of timing their investments to avoid being right too soon as Robertson had been.
In the aftermath of the dot.com bubble, Robertson sponsored several of his former employees in setting up their own hedge funds.
He would provide them with initial capital for a stake in their fund. He would continue to mentor them. And he would help them create a network of Tiger Cubs, that would share ideas and research, much like they had inside of Tiger Management, to maximize returns.
These great investors include brand names like Samlyn, Maverick, Lone Pine, HealthCor, and Coatue. Hedge funds that are amongst the most respected investors today.
However, most would agree the most successful and largest of the tiger cubs is Chase Coleman and his firm, Tiger Global.
Coleman and Tiger Global follow Robertson’s fundamental research-driven footsteps. Their strategy is not as simple as focusing just on value companies, like Klarman at Baupost, or growth companies, like Driehaus.
Their goal is to find great thematic ideas that are mispriced by the market, which can run the gamut of deep value, value, GARP, and growth names, depending on the market context.
When looking at Tiger Global’s holdings, anyone using as-reported accounting metrics would likely be scratching their heads. Coleman and his firm are focused on the true fundamentals of companies when they are looking for mispriced firms.
Using traditional as-reported accounting metrics, the fundamentals and KPIs for businesses don’t line up with the accounting. It is only once those holdings are looked at with a lens that better represents economic reality, and lines up with the KPIs and real fundamentals, that their investments become apparent.
To show what we mean, we’ve done a high level portfolio audit of Tiger Global’s top holdings, based on their most recent 13-F. This is a very light version of the custom portfolio audit we do for our institutional clients when we analyze their portfolios for torpedos and companies they may want to “lean in” on.
See for yourself below.

Using as-reported accounting, investors would think Coleman and Tiger Global weren’t picking particularly compelling themes, given that the companies exposed to those themes barely had positive return on assets (ROA) on average.
On an as-reported basis, many of these companies are poor performers with returns below 1%, and the average as-reported return on assets (ROA) is at 1%.
In reality, the average company in the portfolio displays an impressive average Uniform ROA at 22% This is almost double current corporate averages at around 12%. These are the kind of companies that likely have fundamental and thematic tailwinds.
Once the distortions from as-reported accounting are removed, we can realize that Microsoft (MSFT) doesn’t have an 11% ROA, it is actually at 33%. Microsoft is a cash generating machine that has earned its $1.8 trillion valuation.
Similarly, Tiger Global’s third largest investment Facebook’s (FB) ROA is really 34%, not 13%. While as-reported metrics are portraying the company as a middling social media business, Uniform Accounting shows the company’s real robust operations.
Alibaba (BABA) is another great example of as-reported metrics mis-representing the company’s profitability.
Alibaba’s ROA isn’t at 5%, it is actually at 119%. Tiger Global appears to understand that market returns for the company arent near the cost-of-capital, but are in fact extraordinary.
The list goes on from there, for names ranging from Spotify (SPOT) and ServiceNow (NOW), to TransDigm Group (TDG), Workday (WDAY), and RingCentral (RNG).
If Tiger Global were focused on as-reported metrics, it would never pick most of these companies because they look like anything like the thematically-powered companies with fundamental tailwinds that are the fund group’s mandate.
But to find companies that can deliver alpha beyond the market, just finding companies where as-reported metrics mis-represent a company’s real profitability is insufficient.
To really generate alpha, any investor also needs to identify where the market is significantly undervaluing the company’s potential.
Coleman and Tiger Global are also investing in companies that the market has low expectations for. Were the firm to beat these expectations, upside follows.
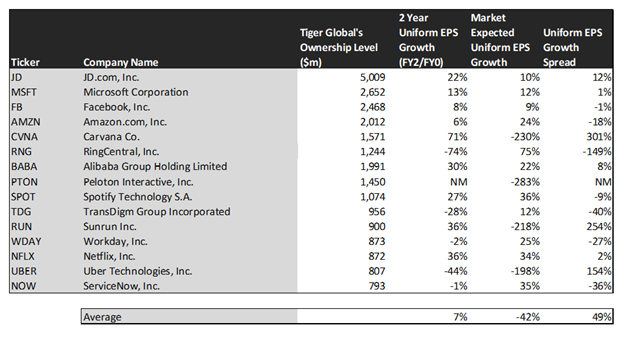
This chart shows three interesting data points:
- The 2-year Uniform EPS growth represents what Uniform earnings growth is forecast to be over the next two years. The EPS number used is the value of when we take consensus Wall Street estimates and we convert them to the Uniform Accounting framework.
- The market expected Uniform EPS growth is what the market thinks Uniform earnings growth is going to be for the next two years. Here, we show by how much the company needs to grow Uniform earnings in the next 2 years to justify the current stock price of the company. If you’ve been reading our daily analysis and reports for a while, you’ll be familiar with the term embedded expectations. This is the market’s embedded expectations for uniform earnings growth.
- The Uniform EPS growth spread is the spread between how much the company’s Uniform earnings could grow if the Uniform earnings estimates are right, and what the market expects Uniform earnings growth to be.
Tiger Global is not just finding high quality companies with significant thematic-driven growth opportunities though, it is finding mispriced companies.
The average company in the US is forecast to have 5% annual Uniform Accounting earnings growth over the next 2 years. Tiger Global’s holdings are forecast by analysts to outpace that, with the median company forecast to have 7% a year earnings growth the next 2 years.
On average, the market is pricing these companies to shrink earnings by 42% a year. While these companies are growing robustly, they are intrinsically undervalued, as the market is mispricing their growth by 49% on average.
These are the kinds of companies that are likely to see their stocks rally when the market realizes how wrong it is. Without Uniform numbers, the GAAP numbers would leave everyone confused. And the risk of returns collapsing is low, considering how high quality these companies are.
One example of a company in the Tiger Global portfolio that has growth potential that the market is mispricing is JD.com (JD), Tiger Global’s largest holding. JD.com’s Wall Street analyst forecasts have 22% Uniform earnings growth built in, but the market is only pricing the company to have earnings grow by 10% each year for the next two years.
Another company with similar dislocations is Sunrun (RUN). The market is expectating 218% shrinkage in earnings. However, the company is actually forecast for Uniform EPS to grow by 36% a year.
Yet another is Uber Technologies (UBER), which is priced for a 198% shrinkage in Uniform earnings, when the company is only forecast to shrink by earnings by 44% a year.
That being said, there are a few companies we’d recommend Tiger Global look at again before holding. Either the rest of the market has not caught up with the themes Tiger Global is watching yet, or Tiger has misjudged these companies’ growth.
RingCentral (RNG) is forecast to see Uniform earnings shrink by 74% a year going forward. However, the market is pricing the company for 75% annual earnings growth.
This doesn’t look like an intrinsically undervalued company. If anything, the market looks significantly too bullish.
But many of Tiger Global’s holdings clearly look like the type of thematically fueled companies with growth tailwinds and upside potential. It wouldn’t be clear under GAAP, but unsurprisingly Uniform Accounting sees the same signals that Tiger Global appears to. Without UAFRS, investors are missing the same signals the professionals use every day.
SUMMARY and JD.com, Inc.’s Tearsheet
As Tiger Global’s largest individual stock holding, we’re highlighting JD.com, Inc.’s tearsheet today.
As the Uniform Accounting tearsheet for JD.com, Inc highlights, JD’s Uniform P/E trades at 27.5x, which is above the corporate average valuation of 25.2x and its own historical valuation of 23.2x.
High P/Es require high EPS growth to sustain them. In the case of JD, the company has recently shown a 92% Uniform EPS growth.
Wall Street analysts provide stock and valuation recommendations that in general provide very poor guidance or insight. However, Wall Street analysts’ near-term earnings forecasts tend to have relevant information.
We take Wall Street forecasts for GAAP earnings and convert them to Uniform earnings forecasts. When we do this, JD’s Wall Street analyst-driven forecasts are 99% EPS growth in 2020 and 16% EPS shrinkage in 2021.
Based on current stock market valuations, we can back into the required earnings growth rate that would justify $88.69 per share. These are often referred to as market embedded expectations.
The company can have Uniform earnings grow by 18% each year over the next three years and still justify current price levels. What Wall Street analysts expect for JD’s earnings decline is above what the current stock market valuation requires in 2021, and in line with market expectations in 2022.
Furthermore, the company’s earning power is 5x the corporate average. Also, cash flows and cash on hand are almost 5x its total obligations—including debt maturities, capex maintenance, and dividends. Together, this signals a low credit and dividend risk.
To conclude, JD’s Uniform earnings growth is above its peer averages, while their valuations are traded below its average peers.
Best regards,
Joel Litman & Rob Spivey
Chief Investment Strategist &
Director of Research
at Valens Research


