
This professor is the Indiana Jones of finance, and Uniform Accounting shows how his fund is the holy grail of investment strategies

Much like Indiana Jones, this hedge fund titan has spent his fair share of time in the classroom, but what has really made him famous is his success in applying his knowledge in the field.
Thanks to his team’s research at the forefront of quantitative investing, his fund has had the strongest sustained returns of any investment great in the recent past.
While his process doesn’t focus solely on accounting but rather pattern recognition, UAFRS-based financial metrics show how he has found the proverbial alpha-focused holy grail of investment strategies, and his process is identifying stocks with very attractive upside signals.
In addition to examining the portfolio, we’re including a deeper look into one of the fund’s largest current holdings, providing you with the current Uniform Accounting Performance and Valuation Tearsheet for that company.
Investor Essentials Daily:
Friday Uniform Portfolio Analytics
Powered by Valens Research
Note from Valens: We originally published this article in February. In honor of our recently launched QGV 50 quantitative product, we are re-publishing our analysis of the quantitative titan, Renaissance Technologies, with an updated portfolio analysis.
In Raiders of the Lost Ark, Indiana Jones is teaching an Archaeology 101 class before Marcus Brody comes to him to send him on his quest to find the Ark of the Covenant.
His students hung on to his every word, not just because they wanted to excel in the class, but they wanted him to grade their exams. They even tried to break down his door to get him to do that after the lecture was over.
While they viewed Indy as a teacher—and a hard one to pin down at that—little did they know where Indy had been before, or where he’d go after.
They didn’t know that Indiana Jones had been an adventure-driven archaeologist for years, from his youth when he found the Cross of Coronado, to having recently survived a temple run at the Temple of the Chachapoyan Warriors.
They also didn’t know where Indy would be heading when he snuck out the window of his office, off to find the Ark. In a future adventure during World War II, he would successfully discover and identify the Holy Grail in a race against time against the Nazis.
In much the same way, one wonders if the students at Jim Simons’ class at Stony Brook University in Long Island knew who they were studying under.
After Simons graduated MIT and Berkeley with a PhD in mathematics, he contributed to developing a great deal of research on manifolds and characteristic classification work. These are complex areas of geometric studies.
This work lent itself to cryptography, and so his work caught the attention of the National Security Agency (NSA). They wanted Simons to work as a code breaker, which he did for the NSA and Institute for Defense Analyses (IDA) until 1968 when he joined Stony Brook’s faculty, eventually becoming the chairman of the math department.
But it is what Simons did after he left his students at Stony Brook full time that is impressive.
Much like Indiana Jones, Simons set off to find the holy grail…and found it.
Simons found the holy grail of investing, an investment strategy that could generate returns so massive that even after steep fees, it would trounce the market and rarely have negative returns.
Simons founded Renaissance Technologies, one of the most respected quantitative hedge funds in the world, in 1978. It was originally called Monemetrics, before it changed its name in 1982.
Renaissance’s flagship Medallion Fund, which has been closed to outside investors since 1993, and has not had any outside money at all since 2005, did 98.2% in 2008 when the S&P was down 38.5%.
It has produced an annualized 66% gross return since 1988, and a 39% net annualized return even after the fund’s significant fees. Over the 12 years from 1993 to 2005, the fund only posted 3 down quarters.
It is arguably the most impressive track record in the entire investing industry.
Simons built Renaissance on a few key principles.
The first was a deep focus on pattern recognition analysis, similar to the type of work his thesis was on, and that he worked on in the realm of cryptography.
The second principle was to stay as far away from MBAs and those with a Wall Street background. Instead, Renaissance is sometimes stated as having one of the best math and physics departments of any institution, academic or corporate, in the world.
Simons’ view is that the groupthink across Wall Street on how the market should work, the relationships assets should have, and the type of education and information that is useful are part of the reason the market is sometimes as inefficient as it is.
Instead, utilizing a team of expert physics and math PhDs, Renaissance has been analyzing correlations and relationships between markets, corporate fundamentals, and various datasets for decades. Renaissance was working with petabyte-sized databases long before big data was a term used in business and in investing.
Even as other quantitative investors have attempted to catch up to Renaissance, the company’s strategies and research continue to unlock significant value.
Much like Bridgewater, that we wrote about in January, Renaissance’s focus is not having analysts actively picking stocks. The firm’s quantitative strategies identify stocks and other assets to buy and sell using the company’s research.
But even without active stock pickers, looking at the stocks Renaissance’s process identifies to generate alpha is instructive.
It is an interesting exercise to see if Uniform Accounting lines up with the quantitative strategies Renaissance is using.
Unsurprisingly, for the most part, Renaissance’s analytics appear to be steering the portfolio to companies that Uniform Accounting metrics highlight are much higher quality and have higher potential than the market and as-reported metrics imply.
For years, big institutional investors like Renaissance have been using better data to power their quantitative models. We want to give broader access to this type of quantitative analysis, and through significant research have found an incredibly simple strategy, using Uniform Accounting, to do so.
We call this strategy the Uniform QGV 50, for Quality, Growth, and Value.
We’ve launched a new product for subscribers to get access to this data. We hosted an event about it in November, which you can watch a replay of here.
If you’re interested in getting access to this simple framework for finding the same type of powerful insights that big institutional investors are finding, you can sign up to get access here.
Now let’s take a look at how Renaissance’s holdings look under the lens of Uniform Accounting.
We’ve conducted a portfolio audit of Renaissance’s top holdings, based on its most recent 13-F.
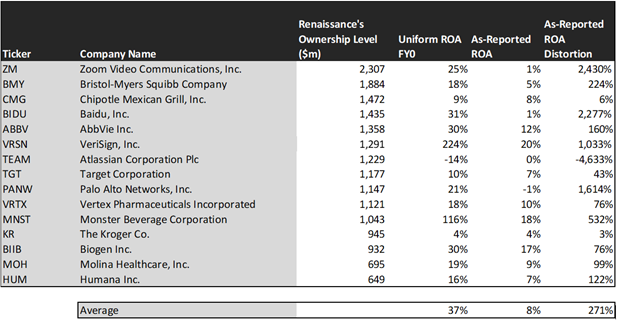
On an as-reported basis, many of these companies are poor performers with returns at 10% or below, with the average as-reported return on assets (ROA) right around 8%.
In reality, the average company in the index displays an impressive average Uniform ROA of 37%.
Once we make Uniform Accounting (UAFRS) adjustments to accurately calculate earnings power, we can see the underlying strength of the portfolio.
Once the distortions from as-reported accounting are removed, we can see VeriSign (VRSN) does not have a return of 20%, but a sizable ROA of 224%.
Similarly, Monster Beverage’s (MNST) ROA is really 116%, not at 18%. While as-reported metrics are portraying the company as a slightly above-average business, Uniform Accounting shows the company’s truly robust profitability.
The list goes on from there, for names ranging from Palo Alto Networks (PANW) and Baidu (BIDU), to AbbVie (ABBV).
If investors were to only look at as-reported metrics, they would assume Renaissance is investing in average and low-quality businesses.
Now, let us see how these firms’ returns can strengthen over time through EPS growth.

This chart shows three interesting data points:
- The 2-year Uniform EPS growth represents what Uniform earnings growth is forecast to be over the next two years. The EPS number used is the value of when we take consensus Wall Street estimates and we convert them to the Uniform Accounting framework.
- The market expected Uniform EPS growth is what the market thinks Uniform earnings growth is going to be for the next two years. Here, we show by how much the company needs to grow Uniform earnings in the next 2 years to justify the current stock price of the company. If you’ve been reading our daily analyses and reports for a while, you’ll be familiar with the term embedded expectations. This is the market’s embedded expectations for Uniform earnings growth.
- The Uniform EPS growth spread is the spread between how much the company’s Uniform earnings could grow if the Uniform earnings estimates are right, and what the market expects Uniform earnings growth to be.
The average company in the U.S. is forecast to have 5% annual Uniform Accounting earnings growth over the next 2 years. In comparison, these top stocks are forecasted by analysts for 13% Uniform earnings growth.
On average, the market is pricing these companies to grow earnings by 12% a year. Analyst’s projections are slightly ahead of the market’s expectations.
One example of a company with high growth potential is AbbVie (ABBV). While the market expects AbbVie to grow by 24% over the next two years, analysts forecast the firm to see 7% shrinkage over the same period.
Another example is Vertex Pharmaceuticals (VRTX). The company is cheap, as it is priced for Uniform earnings to grow by 12%, but the company is forecasted to in fact grow its EPS by 42% in the next two years.
That being said, there are many companies forecast to have earnings growth less than market expectations. For these companies, like Atlassian (TEAM), Palo Alto Networks (PANW), and Chipotle (CMG), the market has growth expectations in excess of analysts’ predictions.
Renaissance’s quantitative portfolio looks like a high quality, undervalued set of stocks with businesses displaying strong earning power. It wouldn’t be clear under GAAP, but unsurprisingly, Uniform Accounting and a system built to deliver alpha see the same signals.
SUMMARY and Zoom Video Communications, Inc.’s Tearsheet
As Renaissance Technologies’ largest individual stock holdings, we’re highlighting Zoom Video Communications, Inc.’s (ZM:USA) tearsheet today.
As the Uniform Accounting tearsheet for Zoom highlights, their Uniform P/E trades at 209.5x, which is above global average valuation levels and its historical average valuations.
Moderate P/Es require moderate EPS growth to sustain them. In the case of Zoom, the company has recently shown a 54% Uniform EPS growth.
Wall Street analysts provide stock and valuation recommendations that in general provide very poor guidance or insight. However, Wall Street analysts’ near-term earnings forecasts tend to have relevant information.
We take Wall Street forecasts for GAAP earnings and convert them to Uniform earnings forecasts. When we do this, Zoom’s Wall Street analyst-driven forecast is a 406% Uniform EPS and a 4% Uniform EPS growth in 2021 and 2022, respectively.
Based on current stock market valuations, we can use earnings growth valuation metrics to back into the required growth rate to justify Zoom’s $472 stock price. These are often referred to as market embedded expectations.
The company would need to grow its Uniform earnings by 122% each year over the next three years to justify their current valuation. What Wall Street analysts expect for Zoom’s earnings growth is way above what the current stock market valuation requires in 2021, but way below that requirement in 2022.
Furthermore, the company’s earning power is 4x the corporate average. Also, cash flows are also almost 10x higher than its total obligations—including debt maturities, capex maintenance, and dividends. Together, this signals low credit and dividend risk.
To conclude, Zoom’s Uniform earnings growth is well above its peer averages in 2020, and is also trading above average peer valuations.
Best regards,
Joel Litman & Rob Spivey
Chief Investment Strategist &
Director of Research
at Valens Research


