
This quant hedge fund used data science to make money during the Great Recession, and only Uniform Accounting can show how

Quantitative hedge funds have seen a boom in recent years as technology continues to advance. Artificial intelligence and machine learning have begun to take over the roles of many traditional hedge fund analysts.
Today, we highlight one of the most successful quantitative hedge funds, with over $60 billion in assets under management. The fund is at the forefront of using artificial intelligence and machine learnings to find signals that outperform.
In addition to examining its portfolio, we are including a deeper look into the fund’s largest current holding, providing you with the current Uniform Accounting Performance and Valuation Tearsheet for that company.
Investor Essentials Daily:
Friday Uniform Portfolio Analytics
Powered by Valens Research
Last week we spoke about the launch of our new product, the QGV 50. It’s a high level product focused on quantitative Uniform Accounting analytics.
QGV stands for “quality, growth, and value”, and it highlights the top 50 names that screen the best on these factors.
The idea behind the portfolio strategy is looking for high return, fast growing, and cheap value names. These are likely to be the companies that will outperform over time.
This relates to our article about the famous Eugene Fama, Kenneth French, and Cliff Asness. Certain factors or investing themes are shown to produce higher returns.
Factor investing and strategies like systematic investing and quantitative investing all stem from a common concept that’s being used frequently in investing recently.
A big driver of these strategies comes down to statistical analysis. It’s necessary to see whether any of these models are predictive or if the data is just noise. Additionally, it is important to see how strong the individual signals—be they factors, investing rules, or specific equations—really are.
If a signal doesn’t generate significant alpha, it might not be worth pursuing. One way to test this is to measure the signal against a benchmark. In other words, how many standard deviations beyond average expected returns it generates. Statisticians call this measure “sigma.”
For factor investors, the point is to identify specific data points that can be measured for each company that drive significant outperformance, often measured in standard deviations, shorthand referred to as sigma.
Quantitative funds operate in similar ways, sometimes through different means. At the end of the day, all of these statistically-driven funds are seeking standard deviations worth of outperformance.
One of the best quantitative hedge funds in the world named itself after the idea of standard deviations. The fund is Two Sigma, representing how much of an outlier its returns are.
Two Sigma was founded in 2001 at the end of the dot-com bubble. Today, it has over $60 billion in assets under management (AUM), making it one of the largest hedge funds in the world.
The fund uses technological methods such as artificial intelligence, machine learning, and distributed computing to find an edge. Two Sigma is focused on using big data to identify signals that will outperform, while minimizing risk.
During the Great Recession, Two Sigma’s funds netted nearly 10%, while most hedge funds suffered heavy losses along with the broader stock market. The firm’s focus on risk management allowed it to limit its downside.
It was the power of Two Sigma’s quantitative strategies that enabled this to happen. Quantitative metrics that you’ll see below unsurprisingly line up much more with Uniform Accounting data than traditional as-reported GAAP accounting data.
For years, big institutional investors have been using better data to power their quantitative models. We want to give broader access to this type of quantitative analysis, and through significant research we have found an incredibly simple strategy, using Uniform Accounting, to do so.
We call this strategy the Uniform QGV 50, for Quality, Growth, and Value.
We’ve launched a new product for subscribers to get access to this data. We hosted an event about it last Friday, which you can watch a replay of here.
If you’re interested in getting access to this simple framework for finding the same type of powerful insights that big institutional investors are finding, you can sign up to get access here.
Now let’s take a look at how Two Sigma’s signals look under the lens of Uniform Accounting.
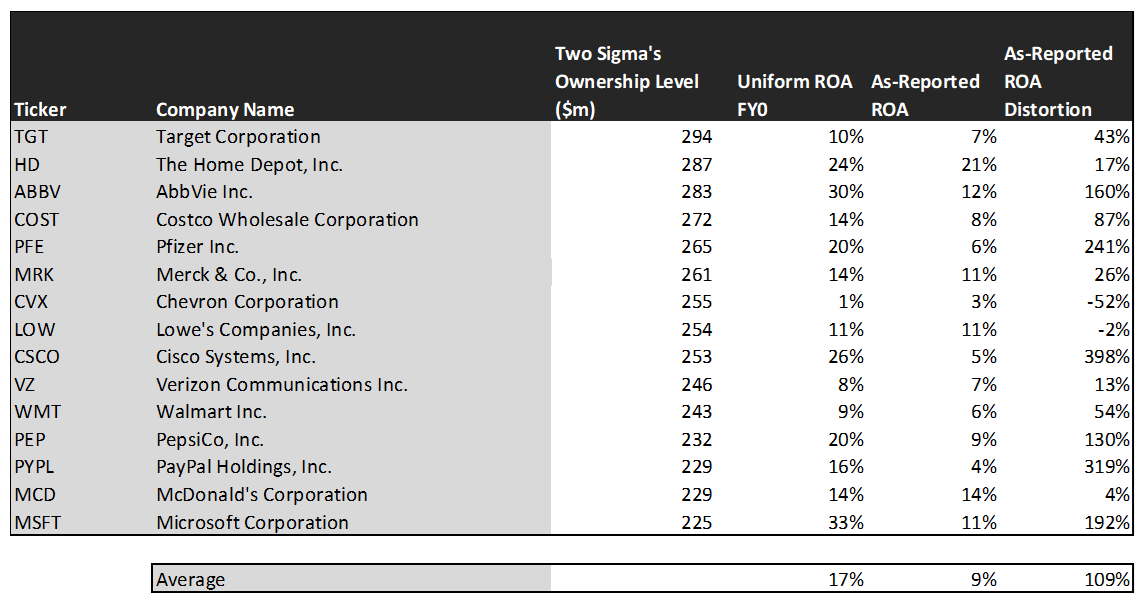
On an as-reported basis, many of these companies are poor performers with returns at 10% or below, with the average as-reported return on assets (ROA) right around 9%.
In reality, the average company in the index displays an impressive average Uniform ROA of 17%.
Once we make Uniform Accounting (UAFRS) adjustments to accurately calculate earnings power, we can see the underlying strength of the portfolio.
Once the distortions from as-reported accounting are removed, we can see Microsoft (MSFT) does not have a return of 11%, but a sizable ROA of 33%.
Similarly, AbbVie’s (ABBV) ROA is really 30%, not at 12%. Uniform Accounting shows the company’s profitability.
The list goes on from there, for names ranging from Cisco (CSCO) and PayPal (PYPL), to Pfizer (PFE).
If investors were to only look at as-reported metrics, they would assume Two Sigma is investing in average and low-quality businesses.
Now, let us see how these firms’ returns can strengthen over time through EPS growth.
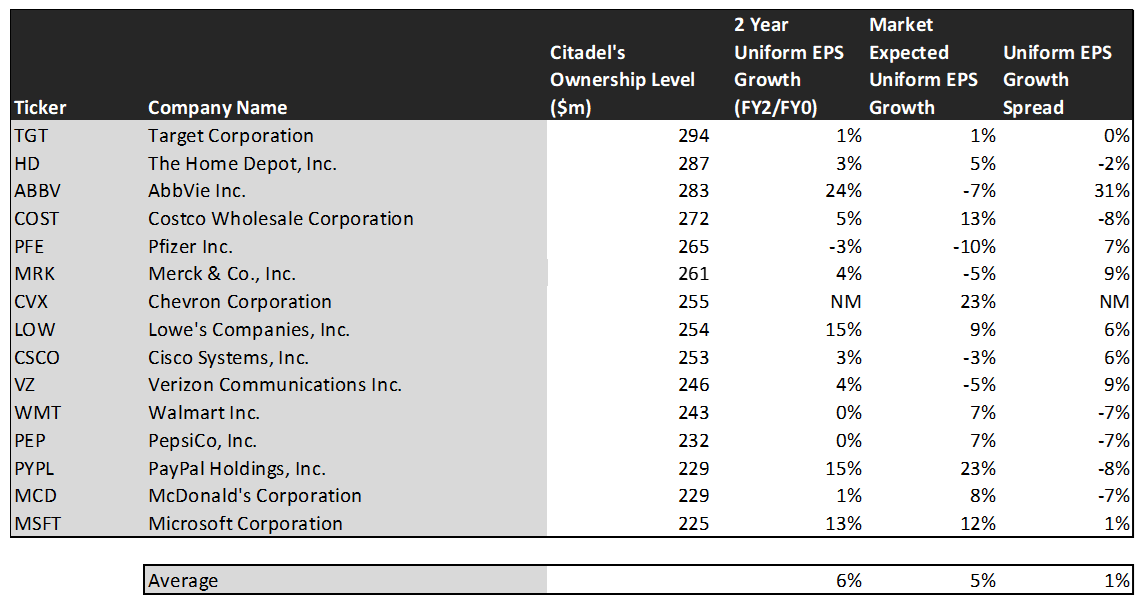
This chart shows three interesting data points:
- The 2-year Uniform EPS growth represents what Uniform earnings growth is forecast to be over the next two years. The EPS number used is the value of when we take consensus Wall Street estimates and we convert them to the Uniform Accounting framework.
- The market expected Uniform EPS growth is what the market thinks Uniform earnings growth is going to be for the next two years. Here, we show by how much the company needs to grow Uniform earnings in the next 2 years to justify the current stock price of the company. If you’ve been reading our daily analyses and reports for a while, you’ll be familiar with the term embedded expectations. This is the market’s embedded expectations for Uniform earnings growth.
- The Uniform EPS growth spread is the spread between how much the company’s Uniform earnings could grow if the Uniform earnings estimates are right, and what the market expects Uniform earnings growth to be.
The average company in the U.S. is forecast to have 5% annual Uniform Accounting earnings growth over the next 2 years. In comparison, these top stocks are forecasted by analysts for 6% Uniform earnings growth.
On average, the market is pricing these companies to grow earnings by 5% a year. Analyst’s projections are slightly ahead of the market’s expectations.
One example of a company with high growth potential is AbbVie. While the market expects AbbVie to grow by 24% over the next two years, analysts forecast the firm to see 7% shrinkage over the same period.
Another example is Verizon Communications (VZ). The company is cheap, as it is priced for Uniform earnings to shrink by 5%, but the company is forecasted to in fact grow its EPS by 4% in the next two years.
That being said, there are many companies forecast to have earnings growth less than market expectations. For these companies, like Costco (COST), PayPal, and Walmart (WMT), the market has growth expectations in excess of analysts’ predictions.
In conclusion, Two Sigma has been effective at using technology to identify signals that outperform.
The largest companies in this fund possess high returns and growth expectations greater than market expectations once we remove the as-reported distortions.
It becomes clear that investing using machine learning and artificial intelligence still creates sizable alpha for quantitative investors.
SUMMARY and Target Corporation Tearsheet
As Two Sigma Investments’ largest individual stock holdings, we’re highlighting Target Corporation’s (TGT:USA) tearsheet today.
As the Uniform Accounting tearsheet for Target highlights, their Uniform P/E trades at 22.9x, which is around global average valuation levels and above its historical average valuations.
Moderate P/Es require moderate EPS growth to sustain them. In the case of Target, the company has recently shown a 14% Uniform EPS growth.
Wall Street analysts provide stock and valuation recommendations that in general provide very poor guidance or insight. However, Wall Street analysts’ near-term earnings forecasts tend to have relevant information.
We take Wall Street forecasts for GAAP earnings and convert them to Uniform earnings forecasts. When we do this, Target’s Wall Street analyst-driven forecast is a 37% Uniform EPS growth in 2021 and a 4% Uniform EPS shrinkage in 2022.
Based on current stock market valuations, we can use earnings growth valuation metrics to back into the required growth rate to justify Target’s $172 stock price. These are often referred to as market embedded expectations.
The company would need to grow its Uniform earnings by 7% each year over the next three years to justify its current valuation. What Wall Street analysts expect for Target’s earnings growth is above what the current stock market valuation requires in 2021, but below that requirement in 2022.
Furthermore, the company’s earning power is 2x the corporate average. Also, cash flows are 2x higher than its total obligations—including debt maturities, capex maintenance, and dividends. Together, this signals low credit and dividend risk.
To conclude, Target’s Uniform earnings growth is in line with its peer averages in 2020 and is also trading around average peer valuations.
Best regards,
Joel Litman & Rob Spivey
Chief Investment Strategist &
Director of Research
at Valens Research