
Kenneth Griffin turned this dorm room fund into the 11th largest hedge fund in the world, and Uniform Accounting shows us how

Factor investing involves using quantifiable attributes to explain and drive differences in stock returns. It has taken off over the past decade as computer algorithms become more advanced and can handle more data.
Today, we highlight one of the most successful factor investing funds. Its founder got his start in his Harvard dorm room and he has grown the fund into one of the largest hedge funds on the planet.
In addition to examining the portfolio, we are including a deeper look into one of the fund’s largest current holdings, providing you with the current Uniform Accounting Performance and Valuation Tearsheet for that company.
Investor Essentials Daily:
Friday Uniform Portfolio Analytics
Powered by Valens Research
When we wrote about AQR one of the investing greats, and the S&P Growth and Value
funds, we talked about the idea of factor investing.
Factor investing is the identification of quantifiable characteristics that explain the difference in stock returns. This strategy has grown in popularity in recent years with the rise of quant funds.
Fama and French popularized some of the first factors, such as size, valuation, and leverage.
However, these are just the surface of factor investing. Factor investing can be used to get exposure to different commodities, currencies, and even thematic investing. Investors can also get exposure to companies in the At-Home Revolution or Survive and Thrive themes.
The largest community of factor investors comes from the University of Chicago. Over the years UChicago was home to Eugene Fama, Kenneth French, and Cliff Asness of AQR.
It’s not surprising then to learn one of the most well respected factor investors in the world is also based out of Chicago. Citadel is one of the world’s largest asset management firms, with over $30 billion in assets under management.
Citadel was started in 1990 by Kenneth Griffin who is ironically a Harvard grad. Griffin got his start trading convertible bonds from his dorm room at Harvard. He launched his first fund just days after his 19th birthday.
Citadel has grown from a $4.6 million startup to one of the largest funds in the world. Despite this, its partner firm Citadel Securities is more well known to investors. Citadel Securities is consistently ranked as the number one market maker in the world.
The asset management arm of Citadel invests in five sectors: commodities, equities, fixed income, quantitative strategies, and credit. Citadel is one of the most prominent factor investing funds in the industry. It should be no surprise Griffin sits on the board of trustees at UChicago, along with other factor investing legends.
For those in the know, seeing Citadel on a new fund manager’s resume carries a lot of weight. It’s a surefire signal the investor knows factor investing and approaches the investing space in this structured way.
However, using as-reported metrics, it appears Citadel is buying into low return companies with declining earnings.
In truth, these securities are already strong performers once Uniform Accounting metrics are universally applied across the portfolio.
It looks like Citadel recognizes it can’t trust the as-reported accounting, similar to the work we do here at Valens.
If you’re interested in finding the types of companies Citadel is finding, we’ve even built a simple 3 step process to capture exactly these companies. Citadel and other top investors are using the right data to identify which companies to buy and you can too.
We’re hosting an event today at 12pm ET, and if you want to learn about how such a simple framework can yield the same powerful results Citadel and other top funds get, you can register to attend the event here.
See for yourself below.
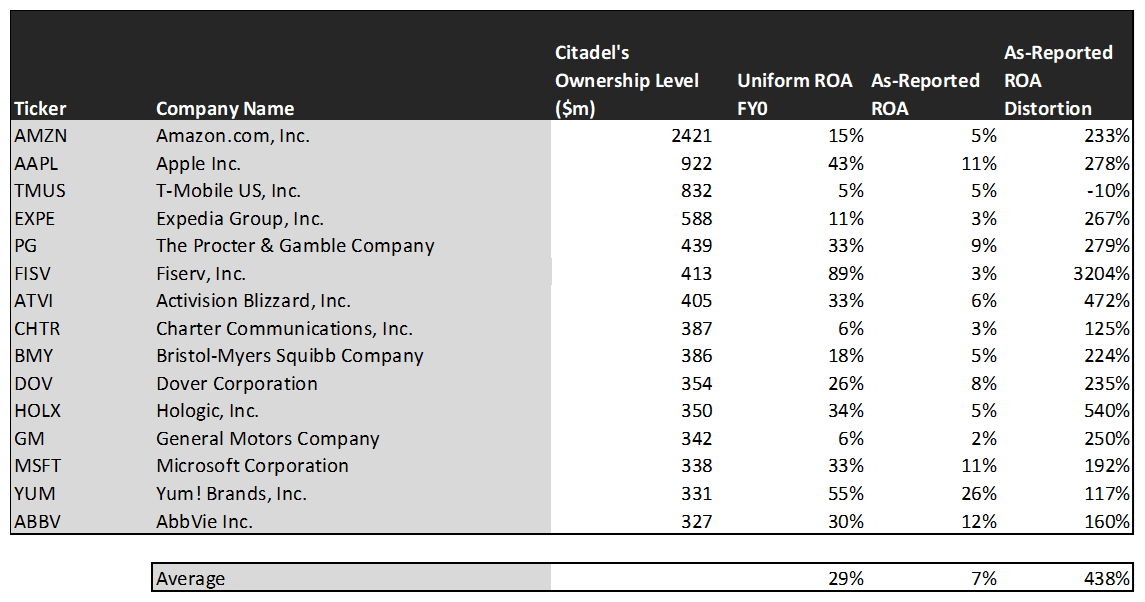
On an as-reported basis, many of these companies are poor performers with returns at or below 10%, with the average as-reported return on assets (ROA) right around 7%.
In reality, the average company in the index displays an impressive average Uniform ROA of 29%.
After making our Uniform Accounting (UAFRS) adjustments to accurately calculate earnings power, we can see the underlying strength of the portfolio.
Once the distortions from as-reported accounting are removed, we can see Fiserv (FISV) does not have a return of 3%, but a sizable ROA of 89%.
Similarly, Apple’s (AAPL) ROA is really 43%, not at 11%. While as-reported metrics are portraying the company as a slightly above average business, Uniform Accounting shows the company’s profitability.
The list goes on from there, for names ranging from Activision Blizzard (ATVI) and Yum! Brands (YUM), to Expedia (EXPE).
If investors were to only look at as-reported metrics, they would assume Citadel is investing in low-quality businesses.
Now, let us see how these firms’ returns can strengthen over time through EPS growth.

This chart shows three interesting data points:
- The 2-year Uniform EPS growth represents what Uniform earnings growth is forecast to be over the next two years. The EPS number used is the value of when we take consensus Wall Street estimates and we convert them to the Uniform Accounting framework.
- The market expected Uniform EPS growth is what the market thinks Uniform earnings growth is going to be for the next two years. Here, we show by how much the company needs to grow Uniform earnings in the next 2 years to justify the current stock price of the company. If you’ve been reading our daily analyses and reports for a while, you’ll be familiar with the term embedded expectations. This is the market’s embedded expectations for Uniform earnings growth.
- The Uniform EPS growth spread is the spread between how much the company’s Uniform earnings could grow if the Uniform earnings estimates are right, and what the market expects Uniform earnings growth to be.
The average company in the U.S. is forecast to have 5% annual Uniform Accounting earnings growth over the next 2 years. In comparison, these top stocks are forecasted by analysts for 1% Uniform earnings shrinkage.
On average, the market is pricing these companies to grow earnings by 5% a year.
One example of a company with high growth potential is Charter Communications (CHTR). While the market expects CHTR to grow by 9% over the next two years, analysts forecast the firm to see 42% growth over the same period.
Another example is AbbVie (ABBV). The company is cheap, as it is priced for Uniform earnings to shrink by 7%, but the company is forecast to in fact grow its EPS by 24% in the next two years.
That being said, there are many companies forecast to have earnings growth less than market expectations. For these companies, like Amazon (AMZN), Fiserv, and Expedia (EXPE), the market has growth expectations in excess of analysts’ predictions.
In conclusion, Citadel has been successful in identifying profitable companies using factor investing.
The largest companies in this fund possess high returns, but growth projections are lower than market expectations once we remove the as-reported distortions.
It becomes clear that using quantifiable characteristics to pick stocks does not mean sacrificing on high-quality businesses.
SUMMARY and T-Mobile US, Inc. Tearsheet
As one of Citadel Advisors LLC’s largest individual stock holdings, we’re highlighting T-Mobile US, Inc.’s (TMUS:USA) tearsheet today.
As the Uniform Accounting tearsheet For T-Mobile highlights, their Uniform P/E trades at 51.0x, which is well above global average valuation levels and its historical average valuations.
High P/Es require high EPS growth to sustain them. In the case of T-Mobile, the company has recently shown a 6% Uniform EPS growth.
Wall Street analysts provide stock and valuation recommendations that in general provide very poor guidance or insight. However, Wall Street analysts’ near-term earnings forecasts tend to have relevant information.
We take Wall Street forecasts for GAAP earnings and convert them to Uniform earnings forecasts. When we do this, T-Mobile’s Wall Street analyst-driven forecast is a 28% and 3% Uniform EPS contraction in 2020 and 2021, respectively.
Based on current stock market valuations, we can use earnings growth valuation metrics to back into the required growth rate to justify T-Mobile’s $128 stock price. These are often referred to as market embedded expectations.
The company would need to grow its Uniform earnings by 19% each year over the next three years to justify its current valuation. What Wall Street analysts expect for T-Mobile’s earnings growth is below what the current stock market valuation requires through 2022.
Furthermore, the company’s earning power is below the corporate average. That said, intrinsic credit risk is only 30bps above the risk-free rate. Together, this signals low credit risk.
To conclude, T-Mobile’s Uniform earnings growth is below its peer averages in 2020, but is trading well above average peer valuations.
Best regards,
Joel Litman & Rob Spivey
Chief Investment Strategist &
Director of Research
at Valens Research


