
This Viking has had to follow his ancestor’s footsteps, exploring new types of investments, Uniform Accounting shows he hasn’t lost his way

Much like his ancestors, this investing great has had to explore new investment landscapes to try to provide for his investors like he did previously.
He’s still keeping the investment strategy that he learned from his mentor, another investing great, but he’s applying it to his normal investments and an entire new group of opportunities to generate strong returns.
GAAP as-reported metrics make it appear that he’s lost his way during this shift.
In reality, UAFRS-based financial metrics help make sense of the stocks he is buying, and how they line up perfectly with his strategy.
In addition to examining the portfolio, we’re including a deeper look into the fund’s largest current holding, providing you with the current Uniform Accounting Performance and Valuation Tearsheet for that company.
Investor Essentials Daily:
Friday Uniform Portfolio Analytics
Powered by Valens Research
When the Vikings landed at Lindisfarne in 793 to raid the monastery there, it kicked off the Viking Age in Europe.
It was an age of terror for Western Europeans that lasted three centuries, as the Vikings went from raiders to controlling much of Britain and Ireland, to founding Normandy, and even controlling Sicily in the Mediterranian.
But the history of the Scanadinavian seafarers goes much further back.
While the Western Europeans viewed this as a new terror sent from God to punish them for, the reality is the Vikings had been trading and raiding across Russia and Eastern Europe, travelling all the way to Constantinople, for some time.
The farmers and fisherman from Denmark, and modern Norway and Sweden had a long-run relationship with both the sea and farming.
The Vikings became traders and raiders because, while they were focused on farming and fishing, those alone could not provide for their people as they grew. Also, a mini-Ice Age led to less productivity of their lands than normal.
The Vikings weren’t just raiding for the sake of raiding. They had to to continue to provide for their people like they’d done historically.
Modern investors have had to do much the same, jumping into, and disrupting, new markets and pursuing new strategies to try to continue to generate the returns their investors expect.
One of those firms is a fund named after its founder’s ancestors. Ole Andreas Halvorsen was born in Norway, and partially took the name of the fund because of his heritage.
Halvorsen is a Tiger Cub. He was incredibly successful studying under Julian Robertson at Tiger Management, where he was a director of equities and on the supervisory board of the firm’s Jaguar Fund.
He left Tiger in 1999 before the fund closed down, starting Viking Global, which grew at one point to over $30 billion in assets under management. However, like all the TIger Cubs, he has remained part of the network of Cubs that all share ideas and strategies, and themes for investing.
One of the things Robertson, Halvorsen, and all the Cubs took from Tiger Management’s downfall was the importance of not just focusing on absolute value when making investments, but understanding the fundamental themes driving the market and companies.
And one of the key trends that Halvorsen and the other Cubs focused heavily in during the second half of the 2010s was the growing importance of venture capital, and how many high flying companies were waiting to enter public equity markets until the real gains had been made.
He understood he couldn’t generate the returns his investors had come to expect just playing in his legacy market, much as the Vikings couldn’t provide for their people without pushing out from their native lands.
So he and many of the other Cubs started to invest in venture capital opportunities along with his legacy equity investments, to supplement returns.
That being said, the vast majority of Viking’s portfolio, over $20 billion, remains in public equity investments, focused on the same kind of companies that Viking has always focused on, undervalued companies with strong fundamental and macro tailwinds.
Analyzing Viking’s portfolio, it’s not obvious that the fund invests in either high quality undervalued names or companies with strong macro tailwinds when using as-reported metrics.
But we’ve conducted a portfolio audit of Viking’s top holdings, based on their most recent 13-F, and Uniform Accounting shows a very different picture.
We’re showing a summarized and abbreviated analysis of how we work with institutional investors to analyze their portfolios.
Unsurprisingly, while Viking’s investments’ as-reported metrics make it look like Viking has lost its way, in reality they appear to be higher quality names, once Uniform Accounting metrics are reviewed.
See for yourself below.
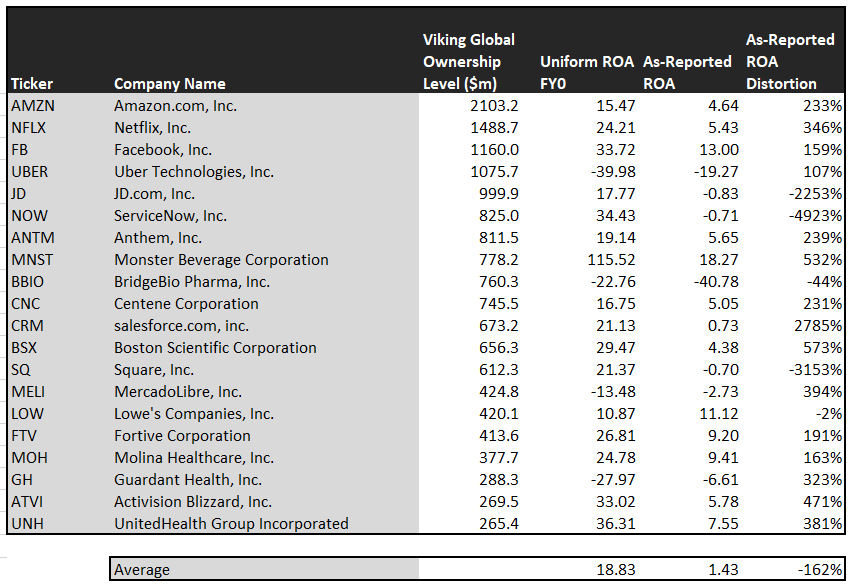
Using as-reported accounting, investors would think Viking was not focusing on companies with strong thematic tailwinds and fundamental upside.
On an as-reported basis, many of these companies are poor performers with returns below 6%, and the average as-reported return on assets (ROA) at 1%.
In reality, the average company in the portfolio displays an impressive average Uniform ROA at 19%. That’s above corporate average returns currently.
Once we make Uniform Accounting (UAFRS) adjustments to accurately calculate earning power, we can see that the returns of the companies in Viking’s portfolio are much more robust.
Once the distortions from as-reported accounting are removed, we can realize that Amazon (AMZN) doesn’t have a 5% ROA, it is actually at 15%. Amazon, Viking’s largest investment, is a strongly profitable innovator.
Similarly, Viking’s second largest investment Netflix’ (NFLX) ROA is really 24%, not 5%. While as-reported metrics are portraying the company as a low return distribution business, Uniform Accounting shows the company’s real robust streaming operations.
The third major FAANG holding for Viking, its third largest holding Facebook (FB), is another great example of as-reported metrics mis-representing the company’s profitability.
Facebook doesn’t have a 13% ROA, it is actually at 34%. Viking appears to understand that market expectations for the company, thinking it’s a low return business, is completely incorrect.
The list goes on from there, for names ranging from JD.com (JD) and ServiceNow (NOW), to Monster Beverage (MNST), salesforce.com (CRM), and Square (SQ).
If Viking were focused on as-reported metrics, it would never pick most of these companies because they look like anything but the high-quality companies with thematic tailwinds that are the fund group’s mandate.
But to find companies that can deliver alpha beyond the market, just finding companies where as-reported metrics mis-represent a company’s real profitability is insufficient.
To really generate alpha, any investor also needs to identify where the market is significantly undervaluing the company’s potential.
Viking is also investing in companies that the market has low expectations for, low expectations the companies can exceed.

This chart shows three interesting data points:
- The 2-year Uniform EPS growth represents what Uniform earnings growth is forecast to be over the next two years. The EPS number used is the value of when we take consensus Wall Street estimates and we convert them to the Uniform Accounting framework.
- The market expected Uniform EPS growth is what the market thinks Uniform earnings growth is going to be for the next two years. Here, we show by how much the company needs to grow Uniform earnings in the next 2 years to justify the current stock price of the company. If you’ve been reading our daily analyses and reports for a while, you’ll be familiar with the term embedded expectations. This is the market’s embedded expectations for uniform earnings growth.
- The Uniform EPS growth spread is the spread between how much the company’s Uniform earnings could grow if the Uniform earnings estimates are right, and what the market expects Uniform earnings growth to be.
The average company in the US is forecast to have 5% annual Uniform Accounting earnings growth over the next 2 years. The median company in Viking’s holdings is forecast by analysts to outpace that, growing at 8% a year the next 2 years. The average company is growing 1%, but that’s distorted by 3 big outliers.
Viking is not just finding high quality companies with strong tailwinds though, it is finding mispriced companies.
On average, the market is pricing these companies to shrink earnings by 38% a year. While these companies are growing robustly, they are intrinsically undervalued, as the market is mispricing their growth by 46% on average.
These are the kinds of companies that are likely to see their stocks rally when the market realizes how wrong it is. Without Uniform numbers, the GAAP numbers would leave everyone confused. And the risk of returns collapsing is low, considering how high quality these companies are.
One example of a company in the Viking portfolio that has growth potential that the market is mispricing is JD.com (JD). JD.com’s Wall Street analyst forecasts have 27% Uniform earnings growth built in, but the market is pricing the company to have earnings grow by 13% each year for the next two years.
Another company with similar dislocations is Anthem (ANTM). Expectations are low, for 7% shrinkage in earnings. However the company is actually forecast for Uniform EPS to grow by 12% a year. While expectations are low, if it can deliver any growth at all, there’s significant upside.
Yet another is the fund’s largest holding, Centene (CNC), is priced for a 1% shrinkage in Uniform earnings, when the company is forecast to grow by earnings by 18% a year.
That being said, there are a few companies we’d recommend Viking look at again before holding.
ServiceNow (NOW) is forecast to see Uniform earnings grow by 13% a year going forward. However, the market is pricing the company for 29% annual earnings growth.
This doesn’t look like an intrinsically undervalued company. If anything, the market looks significantly too bullish.
But many of Viking’s holdings look like a high quality, undervalued set of stocks with businesses displaying strong earning power. It wouldn’t be clear under GAAP, but unsurprisingly Uniform Accounting sees the same signals that Viking appears to focus on.
Amazon.com, Inc. Tearsheet
As Viking Global Investor’s largest individual stock holding, we’re highlighting Amazon.com, Inc.’s tearsheet today.
As our Uniform Accounting tearsheet for Amazon.com, Inc. (AMZN:USA) highlights Amazon’s Uniform P/E trades at 44.6x, which is above the corporate average valuation levels and its own recent history.
High P/Es require high EPS growth to sustain them. In the case of Amazon, the company recently had a 15% Uniform EPS growth in 2019.
While Wall Street stock recommendations and valuations poorly track reality, Wall Street analysts have a strong grasp on near-term financial forecasts like revenue and earnings.
As such, we use Wall Street GAAP earnings estimates as a starting point for our Uniform earnings forecasts. When we do this, we can see that Amazon is forecast to see Uniform EPS shrinkage of 7% in 2020, followed by 16% growth in 2021.
Based on current stock market valuations, we can back into the required earnings growth rate that would justify $2,410 per share. These are often referred to as market embedded expectations.
In order to meet the current market valuation levels of Amazon, the company would have to grow Uniform EPS by 20% each year over the next three years.
What Wall Street analysts expect for Amazon’s earnings growth is below what the current stock market valuation requires.
The company’s earning power, based on its Uniform return on assets calculation, is at 15%, which is 3x the corporate average. Furthermore, with cash flows and cash on hand consistently exceeding debt obligations, Amazon has low credit and dividend risk.
To conclude, Amazon’s Uniform earnings growth is near peer averages. However, the company is currently trading above peer averages.
Best regards,
Joel Litman & Rob Spivey
Chief Investment Strategist &
Director of Research
at Valens Research