
Investors are pricing this company like its spinoff has unlocked significant value, when Uniform Accounting shows a very different story

This timeshare company has recently followed the footsteps of its competitors in separating from its hotel counterpart.
As-reported metrics are making this spin-off look like an equally beneficial transaction. Yet, Uniform metrics are actually revealing this to practically be a one-sided affair.
Also below, Uniform Accounting Embedded Expectations Analysis and the Uniform Accounting Performance and Valuation Tearsheet for the company.
Investor Essentials Daily:
Tuesday Tearsheets
Powered by Valens Research
When United Technologies split into Raytheon Technologies Corporation (RTX), Carrier Global Corporation (CARR), and Otis Worldwide Corporation (OTIS), the value proposition was that investors could now better evaluate each three independently.
All of a sudden, Otis’ high growth business with significant exposure to emerging markets was no longer held back by the valuations of the more stable Carrier and Raytheon businesses.
One big focus of spin-offs, as we’ve highlighted in prior pieces is that it removes a conglomerate discount. Sometimes however, the conglomerate discount isn’t as obvious on first blush. Businesses look complementary, when they really aren’t.
Wyndham Worldwide Corporation is a great example of a company that has benefited recently from a spin-off. It broke up its timeshare and hotel businesses–two businesses that initially appeared related, but on a deeper look are anything but.
Although both the timeshare and hotel business operate in the same industry, hotel companies are more asset-light and typically use franchise agreements.
On the other hand, timeshare companies are real estate developers, not hoteliers. They build the property, hold it until it gets sold, and then collect a nominal fee on the backend, with the real value in the original real estate development.
Today, Wyndham Hotels & Resorts, Inc. (WH) is posting record-high Uniform profitability and an improved credit profile as a result of the 2018 spin-off. Meanwhile, the timeshare business Wyndham Destinations, Inc. (WYND) looks to have benefitted too. Perhaps more management focus has been a positive.
As-reported metrics have made it look like getting rid of the hotel business boosted WYND’s profitability. From 2017 to 2019, the firm’s as-reported return on assets (“ROA”) have rebounded from a low of 4% to a peak of 7%.
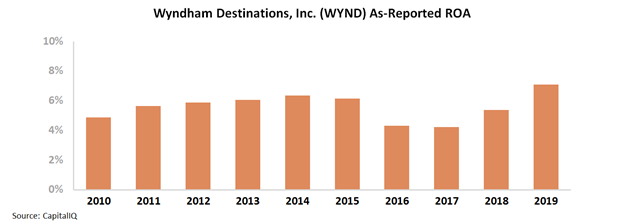
Surprisingly, spinning off what we’d expect to be a higher return business has actually been a good thing for the company.
Or it appears to have been…
In reality, profitability did not benefit from the spin-off. Once Uniform Accounting adjustments have been made it is clear that the solo timeshare business has actually suffered.
Uniform Accounting shows that Wyndham’s returns are still below the levels they were at pre-spinoff. After falling from a peak of 13% in 2016 to 10% levels in 2017-2018, Uniform ROA has only recovered to just 11% in 2019.

The reason Wyndham wanted to get the hotel business on its own is to boost its valuations for investors. Yet investors continue to hope the lower return timeshare spin-off can similarly unlock opportunities, misunderstanding the company’s real return stream.
Considering how the spinoff has barely boosted its profitability since it was completed after looking at the true Uniform Accounting data though, that looks too optimistic.
Wyndham Destinations, Inc. Embedded Expectations Analysis – Market expectations are for Uniform ROA to expand, but management may have concerns about their exchange business, tours, and loan loss provisions
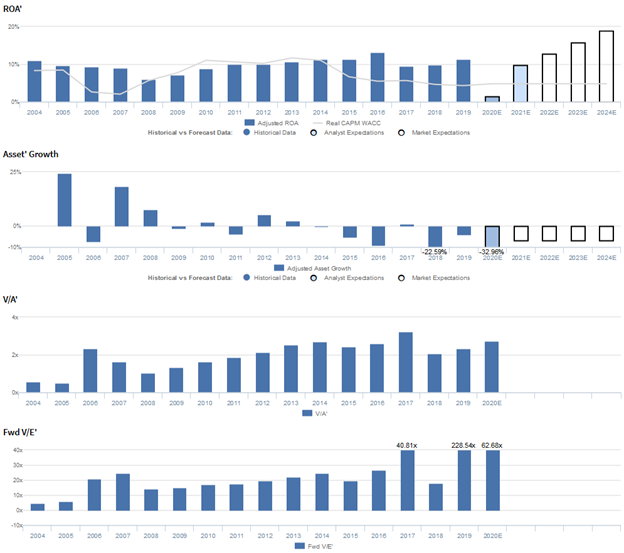
WYND currently trades above historical averages relative to Uniform earnings, with a 62.7x Uniform P/E (Fwd V/E’). At these levels, the market is pricing in expectations for Uniform ROA to expand from 11% in 2019 to 19% in 2024, accompanied by 7% Uniform asset shrinkage going forward.
However, analysts have bearish expectations for the firm, projecting Uniform ROA to fall to 2% in 2020, due to coronavirus-driven headwinds, before recovering to 10% by 2021, accompanied by 33% Uniform asset shrinkage.
Historically, WYND has seen cyclical, but generally improving profitability. In the wake of the Great Recession, Uniform ROA faded from 11% in 2004 to 6% in 2008.Thereafter, Uniform ROA expanded to a peak of 13% in 2016 before declining to and stabilizing at 10%-11% levels through 2019.
Meanwhile, Uniform asset growth has been volatile, positive in only seven of the past fifteen years, while ranging from -9% to 25%, excluding 23% shrinkage in 2018, due to its spin-off of Wyndham Hotels and Resorts.
Performance Drivers – Sales, Margins, and Turns

Cyclicality in Uniform ROA has been driven largely by trends in Uniform earnings margins, slightly offset by trends in Uniform asset turns.
After declining from 14% in 2004 to an 8% low in 2008, Uniform margins recovered to and stabilized at 13%-14% levels from 2010-2015, before climbing to a 20% peak in 2016. Since then, Uniform margins have faded to 13% in 2019.
Meanwhile, Uniform turns ranged from 0.7x-0.8x from 2004-2008 before fading to 0.6x in 2009 and expanding to 0.9x in 2015. Subsequently, Uniform turns compressed to 0.6x in 2016 before recovering back to 0.9x levels in 2018-2019.
At current valuations, markets are pricing in expectations for both Uniform margins and Uniform turns to reach new peaks.
Earnings Call Forensics
Valens’ qualitative analysis of the firm’s Q1 2020 earnings call highlights that management may be concerned about their work from home transition, declines in tour volumes, and tour space constraints.
Furthermore, they may lack confidence in their ability to maintain proper health and safety protocols for their customers and improve their gross provisions.
In addition, they may have concerns about the renegotiated inventory agreements in their exchange business, the impact of loan loss provisions on their results, and the sustainability of their ABS market access.
Finally, they may be overstating the effectiveness of their deferral program and their conduit facility’s capacity to support sales volume into 2021.
UAFRS VS As-Reported
Uniform Accounting metrics also highlight a significantly different fundamental picture for WYND than as-reported metrics reflect.
As-reported metrics can lead investors to view a company to be dramatically stronger or weaker than real operating fundamentals highlight. Understanding where these distortions occur can help explain why market expectations for the company may be divergent.
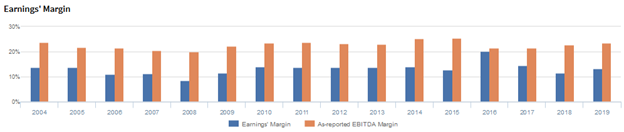
As-reported metrics significantly overstate WYND’s margins, a key driver of profitability. For example, as-reported EBITDA margin for WYND was 24% in 2019, materially higher than Uniform earnings margin of 13%, making WYND appear to be a much stronger business than real economic metrics highlight.
Moreover, since 2016, as-reported EBITDA margin has improved from 22% to 24% in 2019, while Uniform margins have fallen from 20% to 13% over the same timeframe, directionally distorting the market’s perception of the firm’s recent profitability trends.
SUMMARY and Wyndham Destinations, Inc. Tearsheet
As the Uniform Accounting tearsheet for Wyndham Destinations, Inc. (WYND) highlights, the Uniform P/E trades at 62.7x, which is above corporate average valuation levels but below historical averages.
High P/Es require high EPS growth to sustain them. In the case of Wyndham, the company has recently shown a 39% Uniform EPS growth.
Wall Street analysts provide stock and valuation recommendations that in general provide very poor guidance or insight. However, Wall Street analysts’ near-term earnings forecasts tend to have relevant information.
We take Wall Street forecasts for GAAP earnings and convert them to Uniform earnings forecasts. When we do this, Wyndham’s Wall Street analyst-driven forecast is a 134% and 301% shrinkage in 2020 and 2021, respectively.
Based on the current stock market valuations, we can use earnings growth valuation metrics to back into the required growth rate to justify Wyndham’s $29 stock price. These are often referred to as market embedded expectations.
The company needs to have Uniform earnings grow by 2% each year over the next three years to justify current prices. What Wall Street analysts expect for Wyndham’s earnings growth is far below what the current stock market valuation requires in 2020 and 2021.
Furthermore, the company’s earning power is 2x the corporate average. However, the company’s cash flows and cash on hand will consistently fall short of debt headwalls over the next five years. Together, this signals high credit and dividend risk.
To conclude, Wyndham’s Uniform earnings growth is trading below peer averages, but the company is trading above average peer valuations.
Best regards,
Joel Litman & Rob Spivey
Chief Investment Strategist &
Director of Research
at Valens Research