
Engine No.1’s victory over Exxon shows that sometimes David can still beat Goliath

Engine No.1 shocked the world earlier this year when it managed to secure three board seats at Exxon Mobil (XOM).
The scheme proved that ESG initiatives could have legs much more powerful than previously thought.
Read on to learn exactly how a tiny upstart fund gained so much power over one of the world’s largest energy companies.
Also below, a detailed tearsheet of Engine No.1’s largest holding.
Investor Essentials Daily:
Friday Uniform Portfolio Analytics
Powered by Valens Research
Last month, we wrote about Third Point Asset Management in our portfolio review series.
Dan Loeb, the well-known Wall Street veteran who steers Third Point’s $17 billion in assets under management, took a page from an unlikely book: The tiny upstart fund Engine No. 1.
Although we already discussed some of what makes this fund’s story so interesting in that piece, Engine No. 1 deserves a piece of its own. Let’s jump in.
In this series, we typically cover the hedge fund juggernaut funds like Point72, Elliott Management, Soros Fund Management, and dozens of others. These titans have shaped not only the investment world of today, but also the corporate and financial worlds at large.
Engine No. 1 is different. Last year, when it opened for business with only $250 million of assets, it entered into the fragmented world of small niche funds. But its founders had a more nuanced mission than most of their peers.
The goal of this San Francisco-based activist fund was to align profit potential with social good, a tactic broadly referred to as “ESG investing”.
Christopher James, the principal founder, was no typical ESG investor. After having some success at various hedge funds in the 1990s, he started several fossil fuel operations near his midwestern hometown. One was a coal mine; the other was an oil and gas storage company.
At the same time, James was a conservationist, a passion that somewhat contradicted his professional dealings. He spoke about “compartmentalizing” his personal goals away from his investing goals. But after his children began challenging his views on the energy industry with their learnings on climate change, he decided to align his various motivations.
That was the spawn of Engine No. 1.
The central thesis emerged from a study his prior fund, Partner Fund Management, had conducted on the decline of retailers. The study found that in the face of e-commerce, many retailers saw their valuation come under pressure long before the digital competitive threat became apparent on their financial statements.
James figured a similar thing could happen in the energy industry in the face of the shift to renewables.
To steer the ship in the right direction, he figured his best strategy was to infiltrate large energy companies and push them to make changes sooner rather than later. This would position them to thrive ahead of their competition as the world goes green.
The task was seemingly insurmountable for one person. Hence, James recruited the best man for the job: Charles Penner of Jana Partners.
Penner made his name as an ESG activist investor after pushing Apple (AAPL) to address childrens’ addiction to their iPhones via parental controls. It was the first major ESG-focused investor activist campaign.
Penner went on to design Engine No.1’s now-infamous scheme at Exxon Mobil (XON). Given Exxon’s $250 billion market capitalization and the fund’s tiny asset base, a brute-force investment takeover in the style of Elliott Management was off the table. Engine No. 1 only took a tiny $40 million stake or less than 0.02% of the company.
He began quietly talking to Exxon’s largest institutional shareholders, including Blackrock (BLK) and crucially, the California Public Employees’ Retirement System (CalPERS).
In fact, Exxon was chosen as the best possible target specifically because of its investor makeup. CalPERS was a crucial player in Penner’s Apple campaign, and he leaned on his connections there to get started with the Exxon campaign.
The goal was to gain board seats. Candidates were vetted by Engine No.1 and Exxon’s institutional investors in private talks long before Exxon’s existing management was aware of the threat. When the time came for votes to be cast, the existing board was blindsided.
The fund’s three new board seats will be used to realign Exxon’s priorities towards reaching carbon neutrality. Engine No. 1’s success shocked Wall Street and earned the ESG investing world a newfound legitimacy.
But no high can last forever. Penner recently announced his resignation from Engine No. 1.
Although details are foggy, it appears he may have been pushed out due to a disagreement with James about the intensity of their ESG activism. James prefers a more passive approach, while Penner seeks to aggressively push companies to make changes.
To see if Engine No. 1 is positioned for success without Penner, let’s take a look at its largest investments from a Uniform Accounting perspective.

Although the fund broke into public relevance with its Exxon scheme, Engine No. 1 has made numerous other investments. Some of these come with activist intentions, while others are purer ESG plays, and some are less outright-focused on ESG.
If you looked at the aggregate return on assets (“ROA”) of these companies, you’d see figures wildly distorted by GAAP conventions.
GAAP allows for large swings in net income caused by one-time line items that have little to do with the operations of a business. It also has questionable rules for M&A accounting that lead to over-inflated balance sheets, and a fundamentally flawed approach to understanding companies’ R&D investments.
Uniform Accounting standards correct for over 130 such inconsistencies. When looking at Engine No. 1’s investments using Uniform Accounting, we see that their aggregate ROA isn’t 3%, below the cost of capital. It’s actually 11%.
That, however, is still below the corporate average of 12%. But this is normal for activist funds that seek to influence poorer performing companies to improve their operations.
Investors need to remember… Finding companies that perform well is a common and important first step in investing, but it does not hold the key to finding alpha.
Investors need to find those companies that perform well, but are priced to perform poorly. Without the visibility of Uniform Accounting, this may be difficult to quantify. Thanks to our team’s Embedded Expectations Analysis, we can see exactly what a company is priced to do.
The chart below compares analyst-expected returns with market-expected returns. When there is a severe dislocation between the two, it can often mean the market is failing to understand something about a company. See for yourself:
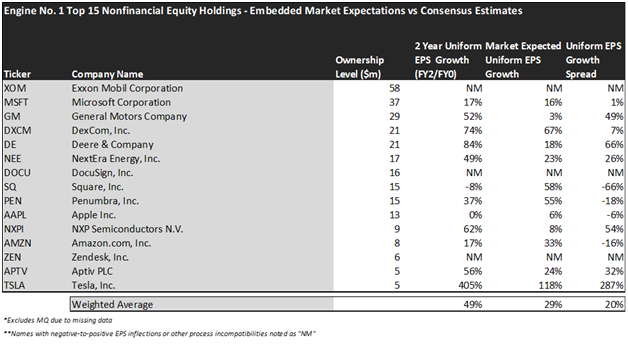
This chart shows four interesting data points:
- The 2-year Uniform EPS growth represents what Uniform earnings growth is forecast to be over the next two years. The EPS number used is the value of when we take consensus Wall Street estimates and we convert them to the Uniform Accounting framework.
- The market expected Uniform EPS growth is what the market thinks Uniform earnings growth is going to be for the next two years. Here, we show by how much the company needs to grow Uniform earnings in the next 2 years to justify the current stock price of the company. If you’ve been reading our daily analyses and reports for a while, you’ll be familiar with the term embedded expectations. This is the market’s embedded expectations for Uniform earnings growth.
- The Uniform EPS growth spread is the spread between how much the company’s Uniform earnings could grow if the Uniform earnings estimates are right, and what the market expects Uniform earnings growth to be.
While the market has priced these companies to grow their Uniform EPS by 29% over the next two years, analysts have more bullish expectations. They expect Uniform EPS to grow by 49% over the same time frame.
This sets investors up favorably, as these analysts have better visibility into what the companies they cover are really doing. If the market has embedded worse expectations than analysts, these stocks could be set up for a wave of upside surprises as analyst expectations come to fruition.
For example, take a look at General Motors (GM). The market is pricing the automaker to see annual Uniform EPS growth of only 3% over the next two years, below the corporate annual EPS growth average of 5%. Analysts, however, recognize that with the easing of supply chain pressures and payoff from the firm’s EV investments, real earnings growth will be much higher. Hence, they expect annual Uniform EPS growth of 52%.
Another example is Deere & Company (DE). While the market is pricing the company to grow its Uniform EPS by 18% over the next two years, analysts are far more optimistic, with an expectation for 84% EPS growth.
Overall, Embedded Expectations show that the fund is favorably positioned. But investors should think twice before co-investing with the fund. Christopher James’ objective isn’t just to generate excess returns for himself and his investors, but to accomplish ESG goals.
These goals may take time, and they may come at the expense of shorter-term profitability. The strategy is unproven, and only time will tell its merits.
Alternatively, the research process used at Valens is proven. It has consistently outperformed the market over the past fifteen years, with our top ten names by conviction outperforming the S&P 500 by 13 percentage points.
See how our research process can put you ahead of the market. Learn more about getting access to the flagship Conviction Long List here, or our quantitative list, the QGV 50, here.
Read on to see a detailed tearsheet of Exxon Mobil.
SUMMARY and Exxon Mobil Corporation Tearsheet
As Engine No. 1’s largest individual stock holdings, we’re highlighting Exxon Mobil Corporation’s tearsheet today.
As our Uniform Accounting tearsheet for Exxon Mobil Corporation (XOM:USA) highlights, its Uniform P/E trades at 19.3x, which is below the global corporate average of 24.0x, but around its own historical average of 18.6x.
Low P/Es require low EPS growth to sustain them. In the case of XOM, the company has recently shown a 559% Uniform EPS decline.
Wall Street analysts provide stock and valuation recommendations that, in general, provide very poor guidance or insight. However, Wall Street analysts’ near-term earnings forecasts tend to have relevant information.
We take Wall Street forecasts for GAAP earnings and convert them to Uniform earnings forecasts. When we do this, XOM’s Wall Street analyst-driven forecast is for EPS to shrink by 172% in 2021 and grow by 16% in 2022.
Meanwhile, the company’s earning power is below the long-run corporate averages. Furthermore, cash flows and cash on hand are below total obligations—including debt maturities, capex maintenance, and dividends. However, intrinsic credit risk is just 30bps. Together, these signal a moderate dividend risk and low credit risk.
Lastly, XOM’s Uniform earnings growth is below peer averages, and the company is trading around its average peer valuations.
Best regards,
Joel Litman & Rob Spivey
Chief Investment Strategist &
Director of Research
at Valens Research