
This Chinese company is cashing in on the success of Apple’s AirPods, with Uniform metrics assembling a TRUE return of 26% and not 8%.

Mobile phones have made it easier for consumers to stream video or music anytime and anywhere. This personal experience has given rise to the smart personal audio device market, which was estimated to have grown by 53% in Q3 2019 compared with Q3 2018.
The fastest growing category in the smart personal audio device market is the true wireless stereo (TWS) devices, which includes Apple’s AirPods. The company that assembles Apple’s wireless bluetooth headset is benefitting from the current demand for the said product.
However, as-reported metrics seem to be hiding the company’s TRUE earning power.
Also below, Uniform Accounting Embedded Expectations Analysis and the Uniform Accounting Performance and Valuation Tearsheet for the company.
Philippine Markets Daily:
Wednesday Uniform Earnings Tearsheets – Asia-listed Focus
Powered by Valens Research
Apple Inc. has been one of the companies in the forefront of technology in the past decade. Its products have revolutionized the world of technology, particularly for retail consumers.
Apple has given us a line of successful products, namely the Mac, iPod, iPhone, and iPad, which have all been successful. The brand created a loyal following, with people lining up in front of Apple stores just to be the first ones to have their newest gadget.
The success of these products can be attributed to their quality, customer satisfaction, and differentiation from the offerings of Apple’s competitors.
Moreover, Apple pairs their gadgets with accessories to further enhance user experience for its products. One of the latest innovations by Apple is the AirPods, which are wireless bluetooth earbuds created for Apple products. These are also compatible with Android, or other bluetooth-enabled devices, though with limited feature accessibility.
To manufacture AirPods, Apple enlisted the services of this Chinese company.
Luxshare Precision Industry Company is a global manufacturer of cable assembly and a major provider of connector system solutions for a wide range of industries, including consumer electronics, enterprise and cloud applications, and automotive and medical.
The company also offers motors, wireless charges, antennas, and acoustic and electronic modules as part of their product portfolio.
Luxshare’s partnership with Apple to produce and supply AirPods has been a significant driver of growth for both companies.
In 2018, Apple sold 35 million AirPods, which accounted for 26% of Luxshare’s revenue. The popularity of the wireless bluetooth earbuds grew in 2019, as Apple reportedly sold almost 60 million AirPods. This success caused Luxshare’s stock price to more than triple that year, becoming one of Asia’s top-performing stocks for 2019.
As demand for AirPods continues to increase, Luxshare started looking into expanding its capabilities through investing in Catcher Technology, the world’s second largest manufacturer of metal casings. If this deal pushes through, it would be Luxshare’s largest investment. It would also enable the company to assemble iPhones and rival Apple’s top supplier, Foxconn.
However, if investors were to look at Luxshare’s profitability, they will likely see a company that has not benefited at all from the strong demand for AirPods. As-reported return on assets (ROA) in 2019 was only at 8%, weaker than what it actually is.
Luxshare’s real economic profitability can be better reflected with Uniform Accounting adjustments to show its TRUE earning power. Looking at the company’s performance in 2010, Luxshare’s Uniform ROA peaked at 31%, which is more than 4x its as-reported ROA of 7%.
One key metric that is causing distortions in as-reported ROAs is R&D expenses.
Luxshare has regular material investments in research and development that they record as an outright expense, as accounting standards would dictate. However, expensing R&D fails to recognize the matching principle that states that expenses should be recognized in the period when the related revenue is incurred.
R&D investment is actually an investment in the long-term cash flow generation of the company. If this remains treated as an expense, the company’s profitability may appear substantially weaker than it actually is.
After R&D and other significant adjustments are made, the company’s Uniform ROA is at 26% in 2019, which is more than 3x stronger than their as-reported ROA of 8%.
Luxshare’s valuations are above corporate averages, but cheaper than as-reported P/E
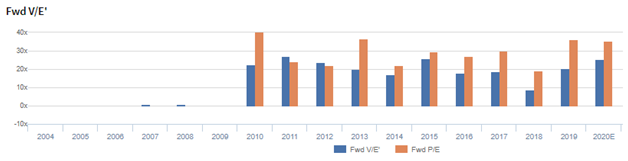
Luxshare Precision Industry Co., Ltd. (002475:CHN) currently trades above corporate averages at a 25.1x Uniform P/E (blue bars), but is cheaper than its as-reported P/E of 35.6x (orange bars).
At these levels, the market is pricing in expectations for Uniform ROA to fall to 10% in 2024, accompanied by 36% Uniform asset growth going forward.
However, analysts have less bearish expectations, projecting Uniform ROA to slightly decrease to 24% in 2021, accompanied by a 36% Uniform asset contraction.
Luxshare’s profitability is much better than you think it is
As-reported metrics are distorting the market’s perception of the firm’s profitability.
If you were to just look at as-reported ROA, you would think that the company is a weaker business than real economic metrics highlight.
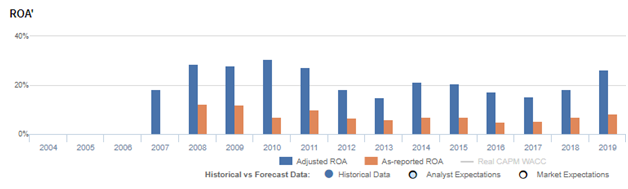
Luxshare’s Uniform ROA has actually been higher than its as-reported ROA in the past thirteen years. For example, as-reported ROA is 8% in 2019, significantly lower than its Uniform ROA of 26%. When Uniform ROA peaked at 31% in 2010, as-reported ROA was just at 7%.
Through Uniform Accounting, we can see that the company’s true ROAs have actually been higher. Luxshare’s Uniform ROA for the past thirteen years has ranged from 15% to 31%, while as-reported ROA ranged only from 5% to 12% in the same timeframe.
After climbing from 18% in 2007 to a peak of 31% in 2010, Uniform ROA gradually fell to 15% in 2013. Afterwards, Uniform ROA recovered to 21% in 2014 before declining to 16% in 2017. Uniform ROA then rebounded to 26% in 2019.
Luxshare’s margins are weaker than you think, but its consistently stronger asset turnover makes up for it

Cyclicality in Uniform ROA has been primarily driven by trends in Uniform asset turns, with peaks and troughs lining up historically with that of Uniform ROA.
Uniform earnings margins improved from 11% in 2007 to 14% in 2009, before falling to 13% in 2010. It then rebounded to 15% in 2011 and declined to 10% in 2013, before surging back to 14% in 2015. Uniform earnings margins then fell back to 10% in 2017, before recovering to 12% in 2019.
Meanwhile, Uniform asset turns increased from 1.6x in 2007 to 2.3x in 2008 before falling back to 1.9x in 2009. It then rebounded to 2.4x in 2010, before compressing to 1.5x-1.6x levels in 2013 to 2017 and subsequently climbing to 2.2x in 2019.
Summary and Luxshare Tearsheet
As the Uniform Accounting tearsheet for Luxshare highlights, they are trading at a 25.1x Uniform P/E, which is around average market valuations but below its historical P/E of 18.3x.
High P/Es require high EPS growth to sustain them. In the case of Luxshare, the company has recently shown a 79% Uniform EPS growth.
Sell-side analysts provide stock and valuation recommendations that in general provide very poor guidance or insight. However, sell-side analysts’ near-term earnings forecasts tend to have relevant information.
We take sell-side forecasts for Chinese Accounting Standards earnings and convert them to Uniform earnings forecasts. When we do this, Luxshare’s sell-side analyst-driven forecast is for Uniform earnings to increase by 32% and 27% in 2020 and 2021, respectively.
Based on current stock market valuations, we can back into the required earnings growth rate that would justify CNY 48 per share. These are often referred to as market embedded expectations.
In order to meet the current market valuation levels of Luxshare, the company would have to have Uniform earnings grow by 10% each year over the next three years. What sell-side analysts expect for Luxshare’s earnings growth is above what the current stock market valuation requires.
The company’s earning power, based on its Uniform return on assets calculation, is 4x corporate average returns. Furthermore, with cash flows and cash on hand consistently exceeding obligations, Luxshare has low credit and dividend risk.
To conclude, Luxshare’s Uniform earnings growth is in line with its peer averages in 2019 and it is also trading in line with peer average valuations.
About the Philippine Market Daily
“Wednesday Uniform Earnings Tearsheets – Asia-listed Focus”
Some of the world’s greatest investors learned from the Father of Value Investing or have learned to follow his investment philosophy very closely. That pioneer of value investing is Professor Benjamin Graham. His followers:
Warren Buffett and Charles Munger of Berkshire Hathaway; Shelby C. Davis of Davis Funds; Marty Whitman of Third Avenue Value Fund; Jean-Marie Eveillard of First Eagle; Mitch Julis of Canyon Capital; just to name a few.
Each of these great investors studied security analysis and valuation, applying this methodology to manage their multi-billion dollar portfolios. They did this without relying on as-reported numbers.
Uniform Adjusted Financial Reporting Standards (UAFRS or Uniform Accounting) is an answer to the many inconsistencies present in GAAP and IFRS, as well as in PFRS.
Under UAFRS, each company’s financial statements are rebuilt under a consistent set of rules, resulting in an apples-to-apples comparison. Resulting UAFRS-based earnings, assets, debts, cash flows from operations, investing, and financing, and other key elements become the basis for more reliable financial statement analysis.
Every Wednesday, we focus on one company listed in Asia that’s relevant to the Philippines and that’s particularly interesting from a UAFRS vs as-reported standpoint. We highlight one adjustment that illustrates why the as-reported numbers are unreliable.
This way, we gain a better understanding of the factors driving a particular stock’s returns, and whether or not the firm’s true profitability is reflected in its current valuations.
Hope you’ve found this week’s Uniform Earning Tearsheet on an Asian company interesting and insightful.
Stay tuned for next week’s Asia company highlight!
Regards,
Angelica Lim
Research Director
Philippine Markets Daily
Powered by Valens Research
www.valens-research.com


