
Despite this one-stop home improvement shop’s strategic partnership with its parent company, Uniform accounting shows weaker profitability

This one-stop shop home improvement store was one of the most attractive IPOs in the Philippines in 2019 due to the firm’s potential collaboration with its parent and sister companies.
Although the company was one of the most traded stocks after inception, its stock price has not performed well since. Uniform metrics show why the stock has underperformed, even though as-reported metrics suggest stronger ROA than it actually is.
Also below, Uniform Accounting Embedded Expectations Analysis and the Uniform Accounting Performance and Valuation Tearsheet for the company.
Philippine Markets Daily:
Tuesday Uniform Earnings Tearsheets – Philippine-listed Focus
Powered by Valens Research
With people continuing to stay at home during the pandemic, the role of a home is more important than ever. The home is no longer just a place of shelter, but it is also now a place for work, study, and recreational activities.
As people spend more time at home, one might think home improvement retailers would be seeing greater success in the current environment. This is currently the case in the US, where the winners are those benefiting from the At-Home Revolution.
However, AllHome Corp. (HOME:PHL), a company that engages in the buying, selling, distributing, marketing, and retailing of all kinds of goods related to homes tells a different story. Since lockdown in mid-March, AllHome’s stock price has deteriorated by more than 30%.
AllHome was established in 2013 by Villar Group of Companies under the leadership of business tycoon Manny Villar. Since its inception, the company has seen steady growth as it has aggressively expanded stores.
Given the firm’s strategic relationship with its parent company Villar Group of Companies and sister companies Vista Land and Golden Bria, AllHome was able to build a total of 45 stores, of which 22 are located in malls. AllHome has not only offered a wide array of options for home improvement, but also a substantial variety of in-house brands.
As a result, AllHome’s sales growth has been ramping up each year, from 43% in 2017 to 68% in 2019.
However, the company’s aggressive revenue growth has negatively impacted its total receivables and inventory. Its write-offs of uncollected receivables have tripled from PHP 5.8 million in 2016 to PHP 19.4 million in 2018. Meanwhile, its total inventory has more than quadrupled from P668 million in 2015 to P2.7 billion in 2018.
Additionally, rapid store expansion has ballooned AllHome’s total debt to PHP 4.65 billion.
To mitigate any liquidity troubles, Villar Group decided to introduce AllHome to public investors on October 11, 2019, intending to use half of the proceeds to pay off its loan. It became one of the most traded stocks during its first two months.
In its third month as a publicly listed company, AllHome’s stock started to trend lower. Then by March, the coronavirus pandemic caused its stock price to further deteriorate from PHP 11.54 during its IPO to as low as PHP 4.50. Since then, AllHome’s stock has been volatile, ranging from PHP 4.50 to PHP 8.05.
Although its stores are gradually reopening and the company has resumed store expansion during the pandemic, the recovery has been sluggish with quarantine restrictions still in place. In addition, the company has been slow to adapt to digitalization, having just recently introduced its mobile app last October.
Expectations for the company have likely been too high, fueled by its as-reported metrics. From 2017 to 2019, AllHome’s as-reported ROA expanded from 3% to 9%.
However, Uniform metrics show that AllHome’s true profitability did not rise as high as what as-reported metrics claimed. AllHome’s Uniform ROA only improved from 2% in 2017 to 7% in 2019.

What as-reported financials have gotten wrong is the depreciation of the company’s fixed assets.
Depreciation expense is a non-cash expense, meaning it does not represent an actual outlay of cash. Also, it can be easily manipulated by changing the asset’s life. As such, depreciation expense should be removed from earnings.
However, the company does spend cash on maintenance capital expenditures to ready the same assets for use in the following years. That said, this expense barely shows up in its entirety on the balance sheet.
To arrive at an estimate of the firm’s maintenance capex, what is done instead is smoothing as-reported depreciation expense over a few years, adjusting for inflation and asset impairments.
In AllHome’s case, PHP 265.2 million of depreciation expense was charged in 2019, but its substantial growth in assets that year warranted PHP 685.2 million in maintenance capex.
Along with the many other adjustments made, adding back depreciation expense and subtracting maintenance capex leads to just PHP 953.3 million in Uniform earnings and a 7% Uniform ROA in 2019, lower than as-reported earnings of PHP 1.05 billion and 9% ROA.
AllHome’s earning power is weaker than you think
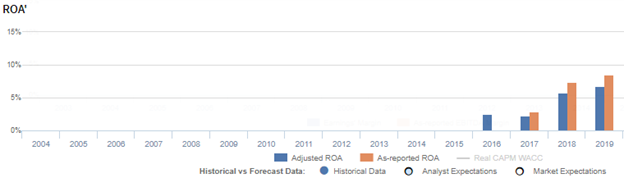
As-reported metrics distort the market’s perception of the firm’s historical profitability. If you were to just look at as-reported ROA, you would think that AllHome’s profitability has been stronger than real economic metrics have highlighted in each of the past three years.
In reality, AllHome’s true profitability has been significantly lower than its as-reported ROA every year. Specifically, as-reported ROA was 9% in 2019, but Uniform ROA was only at 7%.
As-reported ROA expanded from 3% in 2017 to a 9% peak in 2019. Meanwhile, Uniform ROA improved from 2% in 2017 to just 7% in 2019.
AllHome’s margins are weaker than you think

Weakness in Uniform ROA has been driven by weak Uniform earnings margins. Uniform margins have been lower than as-reported EBITDA margins in each of the past four years.
As-reported EBITDA margins rose from 6% in 2016 to 18% in 2019. Meanwhile, Uniform margins improved from just 3% in 2016 to 8% in 2019.
Looking at the firm’s margins alone, the as-reported metrics are making the firm appear to be a more cost-efficient business than is accurate.
SUMMARY and AllHome Corp., Incorporated Tearsheet
As the Uniform Accounting tearsheet for AllHome Corp. (HOME:PHL) highlights, the Uniform P/E trades at 25.6x, which is above corporate averages but around its own history.
High P/Es require high EPS growth to sustain them. However, in the case of AllHome, the company has recently shown a 19% Uniform EPS decline.
Sell-side analysts provide stock and valuation recommendations that provide very poor guidance or insight in general. However, sell-side analysts’ near-term earnings forecasts tend to have relevant information.
We take sell-side forecasts for Philippine Financial Reporting Standards (PFRS) earnings and convert them to Uniform earnings forecasts. When we do this, AllHome’s sell-side analyst-driven forecast calls for a 50% Uniform EPS decline in 2020 and 177% EPS growth in 2021.
Based on current stock market valuations, we can use earnings growth valuation metrics to back into the required growth rate to justify AllHome’s PHP 7.75 stock price. These are often referred to as market embedded expectations.
The company needs Uniform earnings to grow by 22% each year over the next three years to justify current valuations. What sell-side analysts expect for AllHome’s earnings growth is below what the current stock market valuation requires in 2020, but above its requirement in 2021.
Furthermore, the company’s earning power is just around long-run corporate averages. That said, cash flows and cash on hand are 250% of its total obligations—including debt maturities, capex maintenance, and dividends. Together, this signals low credit risk.
To conclude, AllHome’s Uniform earnings growth is well below peer averages in 2020, and the company is trading well below its peer average valuations.
About the Philippine Market Daily
“Tuesday Uniform Earnings Tearsheets – Philippine-listed Focus”
Some of the world’s greatest investors learned from the Father of Value Investing or have learned to follow his investment philosophy very closely. That pioneer of value investing is Professor Benjamin Graham. His followers:
Warren Buffett and Charles Munger of Berkshire Hathaway; Shelby C. Davis of Davis Funds; Marty Whitman of Third Avenue Value Fund; Jean-Marie Eveillard of First Eagle; Mitch Julis of Canyon Capital; just to name a few.
Each of these great investors studied security analysis and valuation, applying this methodology to manage their multi-billion dollar portfolios. They did this without relying on as-reported numbers.
Uniform Adjusted Financial Reporting Standards (UAFRS or Uniform Accounting) is an answer to the many inconsistencies present in GAAP and IFRS, as well as in PFRS.
Under IFRS, each company’s financial statements are rebuilt under a consistent set of rules, resulting in an apples-to-apples comparison. Resulting UAFRS-based earnings, assets, debts, cash flows from operations, investing, and financing, and other key elements become the basis for more reliable financial statement analysis.
Every Tuesday, we focus on one Philippine-listed company that’s particularly interesting from a UAFRS vs as-reported standpoint. We highlight one adjustment that illustrates why the as-reported numbers are unreliable.
This way, we gain a better understanding of the factors driving a particular stock’s returns, and whether or not the firm’s true profitability is reflected in its current valuations.
Hope you’ve found this week’s Uniform Earnings Tearsheet on a Philippine company interesting and insightful.
Stay tuned for next week’s Philippine company highlight!
Regards,
Angelica Lim
Research Director
Philippine Markets Daily
Powered by Valens Research
www.valens-research.com


