
MONDAY MACRO: The market’s idea of the top five high-margin companies might be wrong

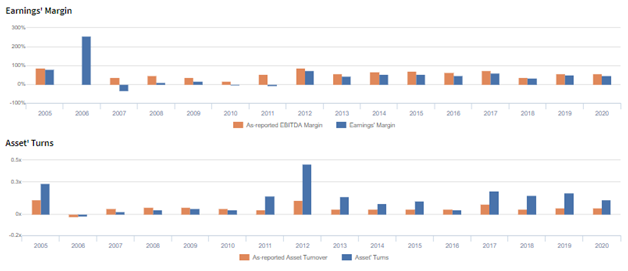
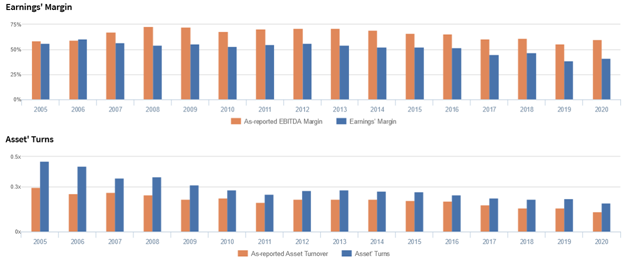
If you recall, there are two main drivers of a company’s profitability: asset turnover and earnings margins. The formula for profitability, or return on assets, itself is straightforward. It’s your earnings over total assets.
However, the tricky part is in figuring out the right accounts and numbers to use, particularly because of the numerous inconsistencies in the financial statements.
Under the Uniform Accounting standards, we can get rid of all these distortions in a company’s financials, leading us to the real numbers that measure the company’s performance.
Philippine Markets Newsletter:
The Monday Macro Report
Powered by Valens Research
In last week’s Monday newsletter, we discussed how looking at a company’s cost efficiency and asset efficiency can help investors evaluate its profitability. Unfortunately, due to distortions caused by accounting standards, users of financial statements still need to clean up the numbers to get a clearer picture of a company’s operations.
We’ve already looked at the top five companies with the highest Uniform asset turns in the PSE. So today, we will check out which of the PSE companies have the highest Uniform earnings margins.
With all the irregularities in accounting standards removed, we’ll see how cost efficient these firms really are compared to what as-reported metrics show.
1. Premium Leisure Corp. (PLC:PHL)

In 2020, the most cost-efficient company in the PSE was Premium Leisure Corp., with Uniform margins of 61%. The gaming investment firm, along with its partners, leases City of Dreams Manila to Melco Resorts (MLCO:USA), in exchange for a cut of the gaming revenues.
Since Melco bears the cost of the integrated resort’s operations, PLC has been able to record high margins. Specifically, with City of Dreams Manila’s opening in Dec. 2014, Uniform margins inflected positively from negative levels in 2014 to 40%+ levels in 2015-2020.
That said, as-reported metrics are giving the company’s cost efficiency more credit than it really needs, with an 82% as-reported EBITDA margin.
One of the reasons why earnings are overstated comes from the inclusion of interest and investment income. This form of income arises from earnings related to the firm’s investment in stocks, deposits, and associates/affiliates, which are not essential to the company’s core operations.
As a result, interest and investment income are removed from a company’s earning’s computation.
2. AREIT, Inc. (AREIT:PHL)

Second, we have the country’s first real estate investment trust (REIT), AREIT, Inc. Removing the distortions found in the company’s taxes, its true 2020 margins are lower than the 78% as-reported metrics show, but still at a strong 54%.
As the REIT of AyalaLand (ALI:PHL), it’s to be expected that AREIT will have such high margins. Much of the costs of real estate are in its construction phase, which are shouldered by AyalaLand, before the properties are transferred to AREIT.
Therefore, as more Philippine real estate firms launch their own REITs in the PSE, it’s likely we’ll see more of them in this list.
3. Vivant Corporation

On the third spot is Vivant Corporation, with Uniform margins of 47%. The company has interests in various electric power companies, including electric power generators, distributors, and electric power supply retailers.
Like in the case of PLC, Vivant derives earnings from its broad portfolio while recording only little of the operating costs. That said, competition in the power generation market is growing each year, which might pose a threat to Vivant’s earnings in the future.
4. Keppel Philippines Holdings, Inc. (KPHB:PHL)
Fourth on the list is Keppel Philippines Holdings, Inc., with Uniform margins of 45%. The firm earns its revenue mainly by renting out its properties.
However, the company’s property portfolio has not grown in the past five years. While the company’s margins are indeed high, it has shown little signs of business growth.
5. Manila Water Company, Inc. (MWC:PHL)
Rounding up the list is Manila Water Corporation, with Uniform margins of 41%. The company is the exclusive water provider in the East Zone of Manila and the Rizal province.
Given Manila Water’s monopoly status, the amount of earnings it can generate depends mostly on how it negotiates and complies with contracts from the government. Historically, as seen in the margin chart, the firm has been successful in this regard.
Meanwhile, looking at its financial statements, the amortization of “service concession assets” is the largest expense impacting earnings. Its non-cash nature means that it does not represent an actual outlay of cash every time amortization is recorded.
That said, even after adding back amortization in its earnings, Uniform margins remain lower than what as-reported margins of 60% show, as interest & investment income and unusual items also distort the company’s performance.
These companies are great examples of how misleading as-reported data can be, which may lead investors to the wrong conclusions on what drives the profitability of these companies.
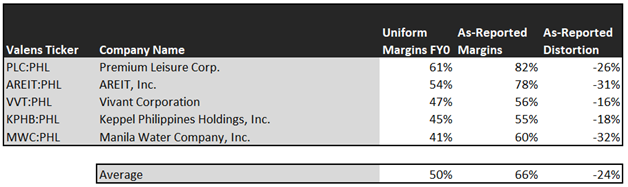
All of the top five margin companies have their margins overstated by 16%-32%, making it look like the group is more cost-efficient than they actually are. In reality, Uniform margins are at a much more reasonable but still strong level of 41%-61%.
Using the correct calculations for earnings margins to assess companies’ profitability is all the more important when evaluating companies whose business models prioritize margins over volumes. If the mess on the financial statements remain, investors will likely get more murky analyses of these companies.
Additionally, it is important to remember that we cannot fully evaluate a company’s profitability with just its earnings margins, which is why Uniform asset turns also need to be paid equal attention.
Next week, we will be discussing how these distortions in margins and turns have impacted the ROAs of the top five margins and top five turns companies.
About the Philippine Markets Newsletter
“The Monday Macro Report”
When just about anyone can post just about anything online, it gets increasingly difficult for an individual investor to sift through the plethora of information available.
Investors need a tool that will help them cut through any biased or misleading information and dive straight into reliable and useful data.
Every Monday, we publish an interesting chart on the Philippine economy and stock market. We highlight data that investors would normally look at, but through the lens of Uniform Accounting, a powerful tool that gets investors closer to understanding the economic reality of firms.
Understanding what kind of market we are in, what leading indicators we should be looking at, and what market expectations are, will make investing a less monumental task than finding a needle in a haystack.
Hope you’ve found this week’s macro chart interesting and insightful.
Stay tuned for next week’s Monday Macro report!
Regards,
Angelica Lim
Research Director
Philippine Markets Newsletter
Powered by Valens Research
www.valens-research.com


