
This company continues to develop amid the pandemic, managing an ROA of 3%, not 1%

This company’s ability to generate break-even to excess economic profits with a diversified portfolio has enabled it to continue searching for growth opportunities. As-reported metrics tell a different story, failing to explain why the company’s performance is not as bad as investors might think.
Also below, Uniform Accounting Embedded Expectations Analysis and the Uniform Accounting Performance and Valuation Tearsheet for the company.
Philippine Markets Newsletter:
Wednesday Uniform Earnings Tearsheets – Philippine-listed Focus
Powered by Valens Research
In 1955, A.L. Gotianun and his wife, Mercedes, founded Filinvest Development Corporation (FDC:PHL) as a business of selling and financing second hand vehicles. Years later, with enough capital from that business, Filinvest expanded beyond its financing business and into real estate.
Today, Filinvest Development engages in financial and banking services through East West Banking Corporation, real estate development and leasing (Filinvest Land Inc.), hotel and resort management (Filinvest Hospitality Corporation), energy (FDC Utilities Inc.), and sugar milling and refining (Pacific Sugar Holdings Corporation).
This diversity in businesses helped Filinvest Development keep the company profitable in 2020 even as its hospitality and resort and real estate businesses suffered due to the pandemic.
Nevertheless, Filinvest Development remains positive that the improving economy will help the company sustain its profitability and its growth initiatives.
To prepare for an expansion after the pandemic, the company continued to allocate billions of pesos into capital expenditures through organic expansion and strategic partnerships with established players.
In order to capitalize on the incentives lined up in the growing real estate industry, Filinvest Development publicly listed its real estate investment trust in Filinvest REIT Corp. (FILREIT) in August 2021.
FILREIT provides an additional investment option that gives the public immediate exposure to a diversified portfolio of residential, commercial, industrial, and office properties across the country. In turn, FILREIT will have access to additional funds to develop the business.
Meanwhile, FDC Utilities started the commercial operations for solar rooftops through a joint venture with ENGIE Services Philippines.
These strategic initiatives and diverse revenue growth opportunities would make one think Filinvest Development has been successful in generating sustainable profitability.
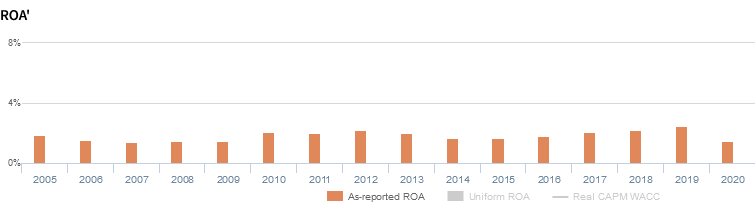
Yet, looking at as-reported metrics, it appears Filinvest Development has not benefited from its diversification. As-reported return on assets (ROAs) show the company has produces little to no economic value for its stockholders, only reaching a high of 3% in 2019.
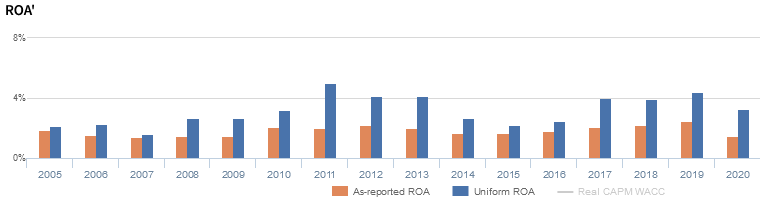
In reality, Uniform Accounting shows that Filinvest Development’s initiative to diversify its business has generated better returns, with Uniform ROAs reaching above cost-of-capital levels at 5%. This difference in returns numbers spells the difference between a company that is generating economic loss and a company that is actually generating economic profits though small.
What as-reported metrics fail to do is to consider the company’s excess cash on the balance sheet. While most companies inherently need some level of cash to operate, the portion of that balance that is earning limited or no return—or excess cash—ends up diluting as-reported ROAs.
When excess cash remains included in the company’s asset base in computing its performance metrics, the company’s profitability and capital efficiency may appear weaker than it actually is.
Removing excess cash allows investors to see through the distortions that come from management carrying much more cash on the balance sheet than what is operationally required.
For 2020, Filinvest Development had a significant amount of excess cash sitting idly in its balance sheet for up to 18% of its as-reported total assets.
Filinvest Development’s earning power is stronger than you think

As-reported metrics distort the market’s perception of the firm’s recent profitability. If you were to just look at as-reported ROA, you would think that the company is a weaker business than real economic metrics highlight, especially with recent years showing below cost-of-capital returns.
Filinvest Development’s Uniform ROA has actually been higher than its as-reported ROA in the past fifteen years. For example, as-reported ROA was 1% in 2020, but its Uniform ROA was actually higher than that at 3%. When Uniform ROA peaked at 5% in 2011, as-reported ROA was only at 2%.
Specifically, Filinvest Development’s Uniform ROA has ranged from 2% to 5% in the past sixteen years, while as-reported ROA has ranged only from 1% to 3% in the same timeframe. Uniform ROA expanded from 2% levels in 2005-2007 to a peak of 5% in 2011, before compressing back to 2% levels in 2015. Subsequently, Uniform ROA recovered to 4% in 2019, before fading to 3% in 2020.
Filinvest Development’s earnings margin is weaker than you think
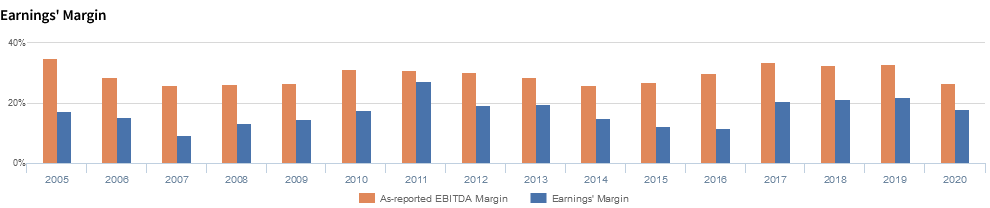
Trends in Uniform ROA have been primarily driven by trends in Uniform earnings margin. Since 2004, Uniform margins have been significantly lower than as-reported EBITDA margins each year.
As-reported EBITDA margins declined from a peak of 35% in 2005 to 26% levels in 2007-2008, before expanding to 31% levels in 2010-2011. Then, as-reported EBITDA margins fell to 26% in 2014, before recovering to 33%-34% levels in 2017-2019, and compressing to 27% to 2020.
Meanwhile, Uniform margins compressed from 17% in 2005 to a low of 9% in 2007, before improving to a peak of 27% in 2011. Thereafter, after contracting to 12% levels in 2015-2016, Uniform margins expanded to 21% levels in 2017-2019 and faded to 18% in 2020.
Looking at the firm’s margins alone, as-reported metrics are making the firm appear to be a more cost efficient business than is accurate.
SUMMARY and Filinvest Development Corporation Tearsheet
As our Uniform Accounting tearsheet for Filinvest Development Corporation (FDC:PHL) highlights, the company trades at a Uniform P/E of 32.4x, above the global corporate average of 24.0x, and its historical P/E of 27.9x.
High P/Es require high EPS growth to sustain them. In the case of Filinvest Development, the company has recently shown a 64% Uniform EPS shrinkage.
Sell-side analysts provide stock and valuation recommendations that in general provide very poor guidance or insight. However, sell-side analysts’ near-term earnings forecasts tend to have relevant information.
We take sell-side forecasts for Philippine Financial Reporting Standards (PFRS) earnings and convert them to Uniform earnings forecasts. When we do this, Filinvest Development’s sell-side analyst-driven forecast is to see Uniform earnings growth of 96% in 2021, but an immaterial decline in 2022.
Based on current stock market valuations, we can use earnings growth valuation metrics to back into the required growth rate to justify Filinvest Development’s PHP 7.80 stock price. These are often referred to as market embedded expectations.
The company is currently being valued as if Uniform earnings were to grow 1% annually over the next three years. What sell-side analysts expect for Filinvest Development’s earnings growth is above what the current stock market valuation requires in 2021, but below the requirement in 2022.
However, the company’s earning power is below the long-run corporate average. Moreover, cash flows and cash on hand are below total obligations—including debt maturities, capex maintenance, and dividends. Together, this signals a moderate dividend risk.
To conclude, Filinvest Development’s Uniform earnings growth is well above peer averages, and currently trades above its average peer valuations.
About the Philippine Markets Newsletter
“Wednesday Uniform Earnings Tearsheets – Philippine-listed Focus”
Some of the world’s greatest investors learned from the Father of Value Investing or have learned to follow his investment philosophy very closely. That pioneer of value investing is Professor Benjamin Graham. His followers:
Warren Buffett and Charles Munger of Berkshire Hathaway; Shelby C. Davis of Davis Funds; Marty Whitman of Third Avenue Value Fund; Jean-Marie Eveillard of First Eagle; Mitch Julis of Canyon Capital; just to name a few.
Each of these great investors studied security analysis and valuation, applying this methodology to manage their multi-billion dollar portfolios. They did this without relying on as-reported numbers.
Uniform Adjusted Financial Reporting Standards (UAFRS or Uniform Accounting) is an answer to the many inconsistencies present in GAAP and IFRS, as well as in PFRS.
Under IFRS, each company’s financial statements are rebuilt under a consistent set of rules, resulting in an apples-to-apples comparison. Resulting UAFRS-based earnings, assets, debts, cash flows from operations, investing, and financing, and other key elements become the basis for more reliable financial statement analysis.
Every Wednesday, we focus on one Philippine-listed company that’s particularly interesting from a UAFRS vs as-reported standpoint. We highlight one adjustment that illustrates why the as-reported numbers are unreliable.
This way, we gain a better understanding of the factors driving a particular stock’s returns, and whether or not the firm’s true profitability is reflected in its current valuations.
Hope you’ve found this week’s Uniform Earnings Tearsheet on a Philippine company interesting and insightful.
Stay tuned for next week’s Philippine company highlight!
Regards,
Angelica Lim
Research Director
Philippine Markets Newsletter
Powered by Valens Research
www.valens-research.com


