
This company found gold with its green strategies, producing a Uniform ROA of 6%, not below cost of capital!

Currently, China is the biggest producer of gold, and is the country with the highest consumption of gold in the world.
Contributing to the country’s gold market is this gold mining company whose commitment to green mining and expansion overseas has accelerated its business.
However, as-reported metrics have buried this company’s profitability below cost-of-capital levels, making it appear a weaker business than what it really is. Uniform Accounting shows that this company’s Uniform return on assets (ROA) is stronger than what is reported.
Also below, Uniform Accounting Embedded Expectations Analysis and the Uniform Accounting Performance and Valuation Tearsheet for the company.
Philippine Markets Daily:
Wednesday Uniform Earnings Tearsheets – Asia-listed Focus
Powered by Valens Research
There’s a saying in China that goes, “Yellow generates yin and yang” (huang sheng yinyang), which means the color yellow is at the center of all things.
According to ancient Chinese history, the Yellow Emperor (Huangdi) was responsible for the birth of the Chinese civilization along the Yellow River (Huanghe). As such, it was the color of royalty, particularly of the emperor. No one but the elite members of the royal family could don yellow garments.
Gold, being so close in color to yellow, also became a symbol of status as it was used for decorative purposes. Thousands of years later, gold is still a status of wealth and success in China.
This cultural significance of gold has paved the way for China to become the world’s largest consumer of gold. China is also the world’s biggest gold producing country for more than a decade.
China’s gold demand is driven by the jewelry industry and investment sector. When we talked about China as a hub for luxurious goods, we mentioned jewelry as one of the most sought after luxuries in the country.
The World Gold Council (WGC) states that Chinese consumers’ appetite for jewelry has been the largest in the world since 2012. In the 1950s, gold played an important role in the Chinese economy as foreign trade payments. It wasn’t until the 1980s when gold was being supplied back to jewellers to revive the jewelry industry.
When China’s economy and consumer spending started to rise in the 1990s, so did demand for China’s jewelry. This built the foundation for Shenzhen as China’s jewelry manufacturing center, producing over 70% of all gold jewelry sold in the country.
In the investment sector, China’s gold bar and coin demand has also been experiencing rapid growth. From just 12 tonnes (t) in 2004, demand has reached about 211t in 2019. Like jewelry, these gold bars and coins are acquired as a part of one’s investment, collection, or to be given as gifts.
Being the world’s largest consumer of gold isn’t the only reason that China’s gold market has been thriving—the country has also been the largest gold producer since 2007. South Africa had been the world’s largest gold producer for over a century until China took its place.
With the growing demand for the precious metal within its borders, China had to find ways to ensure the sustainability of the local gold mining industry. From simply racing to producing the highest amount of gold, the industry shifted to focus on delivering high-quality products. Stricter government environmental policies focused Chinese gold mining companies on addressing environmental, social, and governance (ESG) issues, technological advancements in the field, and overseas expansion.
One of the companies that has vastly contributed to China’s leading gold market is state-owned Shandong Gold Mining Co., Ltd.
The company is one of the largest gold producers in China and in the world. It also operates a gold jewelry purification business and is a leader in China’s non-ferrous (no iron or steel) metals industry.
The rising local demand for gold prompted the firm to accelerate its business through overseas partnerships such as its joint venture with Barrick Gold for the largest gold mine in Argentina, Veladero Gold Mine, in June 2017.
Shandong Gold has also branded itself as “Shandong Gold, Ecological Mining” and continuously follows a green development philosophy by advocating the construction of green mines.
In 2018, the company started to use its Sanshandao Gold Mine as a pilot unit in order to build a “world-class model mine.” In doing so, Shandong Gold embraces what it calls the “12589” strategy.
Each number represents a facet in the strategy:
- focus on the one central goal—“world-class model mine”;
- be international leader in two aspects—“smart mining” and “ecological mining”;
- implement the construction in five themes;
- reach the first-class level in eight aspects; and
- launch the nine kinds of support projects
Shandong Gold already has 12 domestic mines. Even if one of the benefits of ecological mining is extending the life of the mine, eventually, the company will face declines in supply. Hence, Shandong would need to seek other areas to grow—abroad, that is.
With the company’s confirmed USD 165 million acquisition of Canadian mining company TMAC Resources in May 2020, Shandong Gold will have access to high-grade gold and the Arctic Circle. Although both parties have agreed to the acquisition, it is still pending approval from the Canadian government. Those against the purchase have urged the Canadian government to stop the deal since the Arctic Circle contains an abundance of resources and minerals.
Included in Shandong Gold’s portfolio of potential acquisitions is Hong Kong-based Hengxing Gold Holding Co., Ltd. Shandong is proposing an all-stock deal worth roughly USD 387 million to gain control of the Gold Mountain mine in Xinjiang, China.
Another acquisition in the works this year is Cardinal Resources, which has operations in Ghana, West Africa. Shandong Gold recently revised its offer to a higher value of AUD 1 per share, bringing the total acquisition price to a little over USD 400 million.
Given these international partnerships, along with its unique strategies and green mining philosophy, one would think the company is profitable. However, as-reported metrics indicate that its returns are weak, currently sitting at only 3%.

This is an inaccurate representation of Shandong Gold’s overall performance. The company’s real economic profitability is better reflected with Uniform Accounting adjustments, which shows its TRUE earning power.
One of the things that as-reported metrics fail to consider is the amount of goodwill and intangibles on Shandong Gold’s balance sheet.
Intangibles and goodwill are purely accounting-based and unrepresentative of the company’s actual operating performance. When as-reported accounting includes this in a company’s balance sheet, it creates an artificially inflated asset base.

As a result, as-reported ROAs are not showing the real strength of Shandong Gold’s earning power. After intangible assets, goodwill, and other significant adjustments are made, the company actually had a 6% Uniform ROA in 2019, which is stronger than its below cost-of-capital as-reported ROA of 3%.
Shandong Gold’s valuations are above corporate average

Shandong Gold Mining Co., Ltd. (600547:CHN) currently trades above corporate averages at a 28.3x Uniform P/E (blue bars), but below its as-reported P/E of 35.9x (orange bars).
At these levels, the market is pricing in expectations for Uniform ROA to increase to 10% in 2024, accompanied by 13% Uniform asset growth going forward.
Analysts have more bullish expectations, projecting Uniform ROA to elevate to 13% in 2021, accompanied by immaterial Uniform asset growth.
Shandong Gold’s profitability is much better than you think it is

As-reported metrics are distorting the market’s perception of the firm’s profitability.
If you were to just look at as-reported ROA, you would think that the company is a weaker business than real economic metrics highlight.
Shandong Gold’s as-reported ROA has been lower than its Uniform ROA in the past twelve years. For example, as-reported ROA was 3% in 2019, significantly lower than its Uniform ROA of 6%. When Uniform ROA reached an all-time high of 23% in 2011, as-reported ROA was only at 16%.
The company’s Uniform ROA for the past sixteen years has ranged from 5% to 23%, while as-reported ROA ranged only from 3% to 18% in the same time frame.
From 6% in 2005, Uniform ROA increased to 11% levels in 2006-2007, before reaching a peak of 23% in 2011. Then, Uniform ROA fell to 7% in 2015, before rising to 9% in 2016 and settling at 5%-6% levels through 2019.
Shandong Gold’s Uniform earnings margins are weaker than you think but its robust Uniform asset turns make up for it
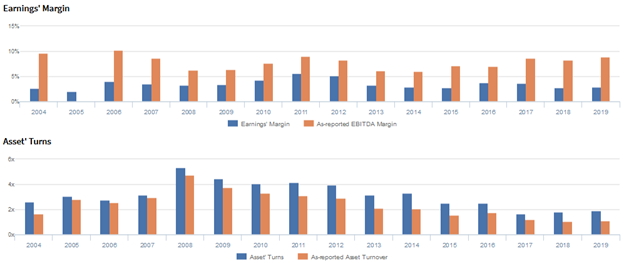
Volatility in Uniform ROA has been driven by trends in both Uniform earnings margins and Uniform asset turns, with peaks and troughs lining up historically with that of Uniform ROA.
In the past sixteen years, Uniform earnings margins have ranged from 3%-6% through 2019, excluding 2% underperformance in 2005.
Meanwhile, Uniform asset turns increased from 2.6x in 2004 to a peak of 5.4x in 2008, before compressing to 1.9x in 2019.
SUMMARY and Shandong Gold Mining Co., Ltd. Tearsheet
As the Uniform Accounting tearsheet for Shandong Gold Mining Co., Ltd. (600547:CHN) highlights, its Uniform P/E trades at 28.3x, which is above corporate average valuation levels but below its own recent history.
High P/Es require high EPS growth to sustain them. In the case of Shandong Gold, the company has recently shown a 15% Uniform EPS growth.
Sell-side analysts provide stock and valuation recommendations that in general provide very poor guidance or insight. However, sell-side analysts’ near-term earnings forecasts tend to have relevant information.
We take sell-side forecasts for Chinese Accounting Standards (CAS) earnings and convert them to Uniform earnings forecasts. When we do this, Shandong Gold’s sell-side analyst-driven forecast is a 186% and 41% earnings growth in 2020 and 2021, respectively.
Based on current stock market valuations, we can use earnings growth valuation metrics to back into the required growth rate to justify Shandong Gold’s CNY 25.50 stock price. These are often referred to as market embedded expectations.
In order to justify current market expectations, Shandong Gold would need to have Uniform earnings grow by 24% each year over the next three years. What sell-side analysts expect for Shandong Gold’s earnings is above what the current stock market valuation requires in 2020 and 2021.
The company’s earning power is a little higher than the corporate average. Additionally, cash flows and cash on hand are more than 2.5x its total obligations—including debt maturities, capex maintenance, and dividends. Together, this signals low dividend and credit risk.
To conclude, Shandong Gold’s Uniform earnings growth is above its peer averages in 2020. Additionally, the company is trading around its peer valuations.
About the Philippine Market Daily
“Wednesday Uniform Earnings Tearsheets – Asia-listed Focus”
Some of the world’s greatest investors learned from the Father of Value Investing or have learned to follow his investment philosophy very closely. That pioneer of value investing is Professor Benjamin Graham. His followers:
Warren Buffett and Charles Munger of Berkshire Hathaway; Shelby C. Davis of Davis Funds; Marty Whitman of Third Avenue Value Fund; Jean-Marie Eveillard of First Eagle; Mitch Julis of Canyon Capital; just to name a few.
Each of these great investors studied security analysis and valuation, applying this methodology to manage their multi-billion dollar portfolios. They did this without relying on as-reported numbers.
Uniform Adjusted Financial Reporting Standards (UAFRS or Uniform Accounting) is an answer to the many inconsistencies present in GAAP and IFRS, as well as in PFRS.
Under UAFRS, each company’s financial statements are rebuilt under a consistent set of rules, resulting in an apples-to-apples comparison. Resulting UAFRS-based earnings, assets, debts, cash flows from operations, investing, and financing, and other key elements become the basis for more reliable financial statement analysis.
Every Wednesday, we focus on one company listed in Asia that’s relevant to the Philippines and that’s particularly interesting from a UAFRS vs as-reported standpoint. We highlight one adjustment that illustrates why the as-reported numbers are unreliable.
This way, we gain a better understanding of the factors driving a particular stock’s returns, and whether or not the firm’s true profitability is reflected in its current valuations.
Hope you’ve found this week’s Uniform Earning Tearsheet on an Asian company interesting and insightful.
Stay tuned for next week’s Asia company highlight!
Regards,
Angelica Lim
Research Director
Philippine Markets Daily
Powered by Valens Research
www.valens-research.com