
This company’s R&D efforts don’t just make your skin glow, they also resulted in a healthy Uniform return of 45%!

Various skincare products have emerged in recent times. From facial washes, toners, moisturizers, and serums, there’s a product that suits your everyday needs.
This Korean R&D-based skin biology company is one of the notable names in the skincare industry. It heavily focuses on its platform technologies and alternative toxicology tests to innovate and differentiate itself from its peers.
However, as-reported metrics do not seem to show how this company’s innovative efforts are positively affecting its returns. Uniform Accounting shows that the business has a better Uniform return on assets (ROA) than what you might think.
Also, below, Uniform Accounting Embedded Expectations Analysis and the Uniform Accounting Performance and Valuation Tearsheet for the company.
Philippine Markets Daily:
Wednesday Uniform Earnings Tearsheets – Asia-listed Focus
Powered by Valens Research
Some of our previous Wednesday PMDs highlighted how the Korean skincare industry has gained major followings due to the rise of the hallyu culture. With Korean artists being portrayed as almost flawless onscreen, consumers were convinced to try out brands these celebrities used or endorsed.
Thanks to the Korean wave and Korea’s pervasive and advanced skincare technology, the skincare industry continues to enjoy an upward revenue trend.
In 2014, Euromonitor International predicted that the global value sales of the skincare industry was expected to reach USD 131 billion. In 2019, sales went beyond that and peaked at USD 532 billion, with Asia contributing half of those sales.
Asia is expected to remain as the sweet spot in the skincare industry, with the help of factors such as its massive population, economic expansion, and consumers’ increasing budget and desire for “vanity spending.”
One company that may benefit from these tailwinds is Caregen Co., Ltd.
As an R&D-based skin biology company, Caregen heavily focuses on its platform technologies and alternative toxicology tests.
In its platform technologies, Caregen specifically researches growth factors, biomimetic peptides, skin delivery systems, and skin stem cell research. The company isn’t the only one using these methodologies, but it’s the only one with over 440 patented biomimetic peptides and 21 registered growth factors. It was also able to obtain 164 patents over other materials that are used all over the world.
One of Caregen’s strategies is to market its products as containing growth factors and biomimetic peptides. Both active ingredients give high efficacy and stability to its double-layered technology and provide competitive pricing based on its mass-production technology.
As for their alternative toxicology test, Caregen can test out specific implications such as skin irritation, skin sensitization, genotoxicity, reproductive toxicity, eye irritation, and skin penetration to ensure the safety and efficacy of its active ingredients.
Caregen was established in 2001 and ventured out into researching growth factor and biomimetic peptide as active ingredients for its products since 2002.
By 2003, Caregen formally established its research and development center to promote research in their active ingredients. As a result, it was able to register their first 11 growth factor ingredients in the Cosmetics, Toiletries, and Fragrance Association (CTFA).
Through their R&D efforts, Caregen crossed the USD 1 million revenue mark as early as 2007.
Today, Caregen is further expanding by venturing into the pharmaceutical industry. Through its R&D-centered philosophy, Caregen aims to provide solutions for various skin diseases such as atopic dermatitis, psoriasis, periodontal disease, and rheumatoid arthritis.
Even though the company has been investing heavily in research and development to advance their products, as-reported returns for 2019 is just at 10% levels, which is substantially weaker than what it actually is.
Caregen’s real economic profitability is better reflected with Uniform Accounting adjustments, which show its TRUE earning power.
One key metric that causes distortions in as-reported ROAs is R&D expenses.
We have highlighted how Caregen puts a premium in its research and development centers to meet consumer demands and further innovate their product line. In as-reported metrics, these investments in R&D were recorded as outright expenses. Because of this, as-reported metrics fail to follow the accounting principle that expenses should be recognized in the period when the related revenue is incurred. This distorts the company’s earning power.
R&D investment is actually an investment in the long-term cash flow generation of the company. If this remains treated as an expense, the company’s profitability may appear substantially weaker than it actually is.
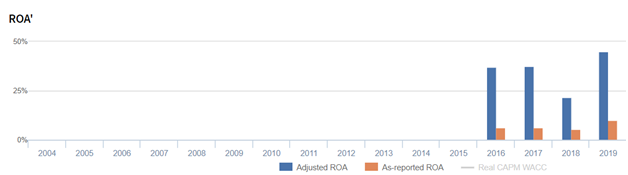
After R&D and other significant adjustments are made, Caregen’s Uniform ROA is at 45% in 2019, which is more than 4x stronger than its as-reported ROA of 10%.
Caregen’s valuations are below corporate averages
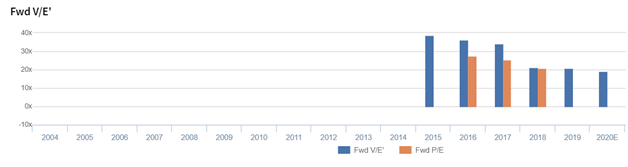
Caregen Co., Ltd. (214370:KOR) currently trades below corporate averages, with a 19.2x Uniform P/E (blue bars).
At these levels, the market is pricing in expectations for Uniform ROA to fall to 34% in 2024, accompanied by a 4% Uniform asset growth going forward.
Analysts have less bearish expectations, projecting Caregen’s Uniform ROA to decrease only to 37%, accompanied by an 11% Uniform asset growth.
Caregen’s profitability is much better than you think it is
As-reported metrics are distorting the market’s perception of the firm’s profitability.
If you were to just look at as-reported ROA, you would think that the company is a weaker business than real economic metrics highlight.
Caregen’s Uniform ROA has actually been higher than its as-reported ROA in the past four years. For example, as-reported ROA was 10% in 2019, significantly lower than its Uniform ROA of 45%. When Uniform ROA reached 38% in 2017, as-reported ROA was just at 6%. The company’s Uniform ROA for the past four years has ranged from 22% to 45%, while as-reported ROA ranged only from 6% to 10% in the same timeframe.
From 37% in 2016, Uniform ROA improved to 38% in 2017, before falling to its all-time low of 22% in 2018. Afterwards, Uniform ROA peaked at 45% in 2019.
Caregen’s Uniform earnings margins are weaker than you think but its robust Uniform asset turns make up for it
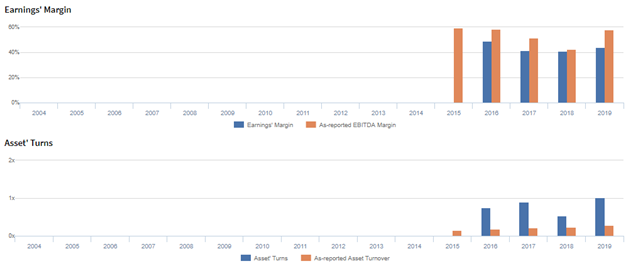
Volatility in Uniform ROA has been driven by trends in Uniform asset turns, with peaks and troughs lining up historically with that of Uniform ROA.
Uniform earnings margins declined from 49% in 2016 to 41% in 2018, before rebounding to 44% in 2019.
Meanwhile, Uniform asset turns improved from 0.8x in 2016 to 0.9x in 2017, before falling to 0.5x in 2018. It then recovered to 1.0x in 2019.
SUMMARY and Caregen Co., Ltd. Tearsheet
As the Uniform Accounting tearsheet for Caregen Co., Ltd. (214370:KOR) highlights, the Uniform P/E trades at 19.2x, which is below corporate average valuation levels and its own recent history.
Low P/Es require low EPS growth to sustain them. In the case of Caregen, the company has recently shown a 38% Uniform EPS growth.
Sell-side analysts provide stock and valuation recommendations that in general provide very poor guidance or insight. However, sell-side analysts’ near-term earnings forecasts tend to have relevant information.
We take sell-side forecasts for Korean International Financial Reporting Standards (K-IFRS) earnings and convert them to Uniform earnings forecasts. When we do this, Caregen’s sell-side analyst-driven forecast is a 1% earnings growth in 2020 followed by 2% shrinkage in 2021.
Based on current stock market valuations, we can use earnings growth valuation metrics to back into the required growth rate to justify Caregen’s KRW 66,000 stock price. These are often referred to as market embedded expectations.
Caregen can have Uniform earnings shrink by 10% in the next three years and still justify current prices. What Wall Street analysts expect for Caregen’s earnings growth is above what the current stock market valuation requires in 2020 and 2021.
The company’s earning power is 7x the corporate average. Also, cash flows are 39x higher than its total obligations—including debt maturities, capex maintenance, and dividends. Together, this signals low credit and dividend risk.
To conclude, Caregen’s Uniform earnings growth is above its peer averages in 2019. The company is also trading above its peer valuations.
About the Philippine Market Daily
“Wednesday Uniform Earnings Tearsheets – Asia-listed Focus”
Some of the world’s greatest investors learned from the Father of Value Investing or have learned to follow his investment philosophy very closely. That pioneer of value investing is Professor Benjamin Graham. His followers:
Warren Buffett and Charles Munger of Berkshire Hathaway; Shelby C. Davis of Davis Funds; Marty Whitman of Third Avenue Value Fund; Jean-Marie Eveillard of First Eagle; Mitch Julis of Canyon Capital; just to name a few.
Each of these great investors studied security analysis and valuation, applying this methodology to manage their multi-billion dollar portfolios. They did this without relying on as-reported numbers.
Uniform Adjusted Financial Reporting Standards (UAFRS or Uniform Accounting) is an answer to the many inconsistencies present in GAAP and IFRS, as well as in PFRS.
Under UAFRS, each company’s financial statements are rebuilt under a consistent set of rules, resulting in an apples-to-apples comparison. Resulting UAFRS-based earnings, assets, debts, cash flows from operations, investing, and financing, and other key elements become the basis for more reliable financial statement analysis.
Every Wednesday, we focus on one company listed in Asia that’s relevant to the Philippines and that’s particularly interesting from a UAFRS vs as-reported standpoint. We highlight one adjustment that illustrates why the as-reported numbers are unreliable.
This way, we gain a better understanding of the factors driving a particular stock’s returns, and whether or not the firm’s true profitability is reflected in its current valuations.
Hope you’ve found this week’s Uniform Earning Tearsheet on an Asian company interesting and insightful.
Stay tuned for next week’s Asia company highlight!
Regards,
Angelica Lim
Research Director
Philippine Markets Daily
Powered by Valens Research
www.valens-research.com


