
This food manufacturing company successfully expanded its brand portfolio to keep up the “illusion of choice,” leading to Uniform ROAs of 10%+

As a consumer, we are given hundreds of options for everyday goods. If we wanted soda, we could choose between 7UP or Mountain Dew. If we wanted some snacks, we could choose between Cheetos, Doritos, or Lays.
But while we think we have unlimited choices… we really don’t—the brands mentioned above seem to compete with each other when, in reality, they’re all owned by Pepsi. That is the case for several other big companies in other product categories.
This food manufacturing company is one of these giants. As-reported ROAs that have largely been below 10% over the past decade would say that the company hasn’t benefited from this “illusion of choice,” but Uniform ROAs that are 3x greater would argue otherwise.
Also below, Uniform Accounting Embedded Expectations Analysis and the Uniform Accounting Performance and Valuation Tearsheet for the company.
Philippine Markets Daily:
Thursday Uniform Earnings Tearsheets – Global Focus
Powered by Valens Research
Picture this… you’re at the supermarket looking to buy a few snacks to restock your pantry with.
You get to the snack aisle and you are presented with shelf upon shelf of options. You’re thinking of whether to get Oreos or Chips Ahoy, and maybe also get some crackers, so you’re choosing between Ritz or Wheat Thins.
You decide to get yourself the Oreos and the Wheat Thins. You walk over to the cashier to pay for your snacks, and while waiting, you see a little stand where they sell the mints. You decide to get some impulsively, choosing Halls over Clorets.
Your choices reflect your tastes and maybe even your brand preferences. However, it doesn’t really matter that much.
Consumers often do not have as much of a choice as they believe when deciding on brand loyalty. To illustrate, we think that the brands above are competing products when, in reality, they are all owned by the same company: Mondelez International.
This is called the “illusion of choice,” and it’s often the case with other major brands too.
For example, Budweiser, Corona, and Stella Artois are all owned by beer company Anheuser-Busch. In the luxury car category, Lamborghini, Porsche, and Bentley are all owned by Volkswagen.
The illusion of choice comes from companies selling products we do not expect them to sell.
Nestle is the biggest consumer goods company in the world, selling more than 2,000 brands. We know that they sell Milo, Nescafe, and Kit Kat. What is less obvious is that they also own Gerber, Hot Pockets, Perrier, and many other brands that seem to compete with each other.
Kellogg Company (K) is the same, albeit at a smaller scale.
Kellogg is known for its cereal brands such as Froot Loops, Frosted Flakes, and of course, Corn Flakes. The company also sells well-known snacks Pop Tarts, Cheez Its, and Pringles—to some people’s surprise.
With over 30 cereal and other breakfast food brands, plus a few savory snacks such as chips and crackers, Kellogg has consistently expanded its brand portfolio to offer more variety amidst changing consumer trends.
More recently, the company has acquired healthy snack companies as consumers move away from sugary snacks, including protein bar company RXBAR, organic breakfast cereal company Kashi, and plant-based snacks company Worthington.
Kellogg has also introduced healthier versions of its existing products. Its Special K cereal now has probiotics and is marketed towards the more health-conscious consumers looking for weight-loss snacks.
The company is also planning to double the amount of Vitamin D in its cereals to help consumers with their daily vitamin requirements.
Overall, Kellogg has expanded its portfolio to be able to offer more products that would suit a wide range of consumers with differing tastes.
This contributed to how the company keeps up the illusion of choice, making its consumers think that they’re choosing between two competing cereal or snack brands when, in fact, it probably owns both of those brands.
So, how has this helped Kellogg’s profits? From 2005-2010, as-reported return on assets (ROA) were at 11%-12% levels before falling to just 6%-8% through 2020, excluding the 13% outperformance in 2013.

In reality, Uniform Accounting shows that the company’s ROAs have been more consistent and are at higher levels, with Uniform ROAs ranging from 9%-19% over the past sixteen years.

The distortion between Uniform and as-reported ROAs comes from as-reported metrics failing to consider the amount of goodwill on Kellogg’s balance sheet. In recent years, goodwill sits at about $6 billion or around one-third of its total assets, stemming from the company’s acquisitions.
Goodwill is an intangible asset that is purely accounting-based and unrepresentative of the company’s actual operating performance. When as-reported accounting includes this in a company’s balance sheet, it creates an artificially inflated asset base.
As a result, as-reported ROAs are not capturing the strength of Kellogg’s earning power. Adjusting for goodwill, we can see that the company isn’t actually performing poorly. In fact, it has been the complete opposite, with returns that are nearly 2x-3x greater.
Kellogg’s earning power is significantly more robust than you think it is
As-reported metrics distort the market’s perception of the firm’s recent profitability. If you were to just look at as-reported ROA, you would think the company is a much weaker business than real economic metrics highlight.
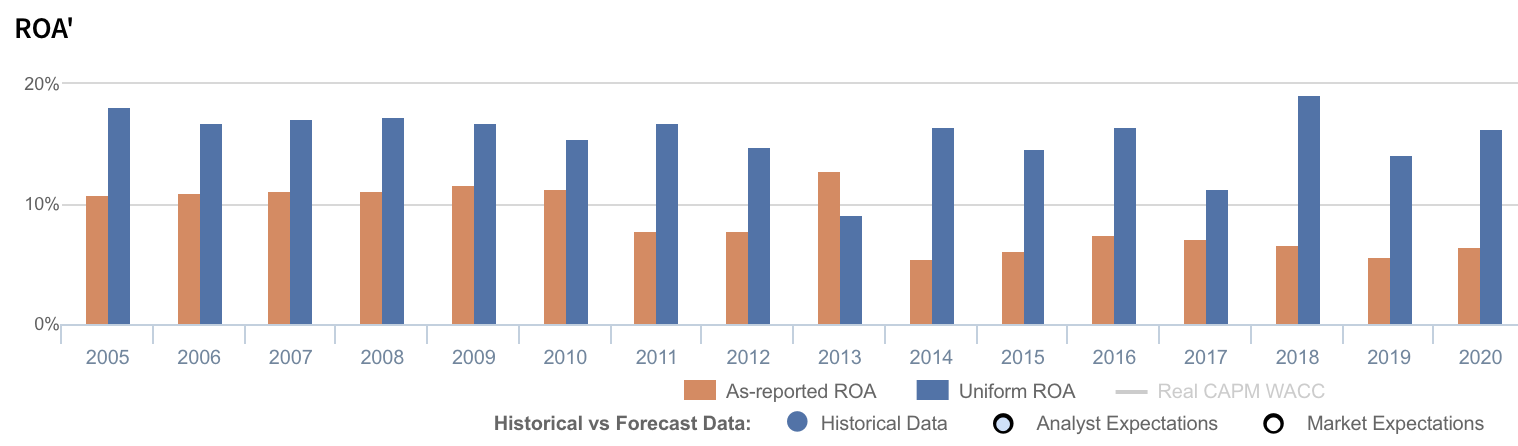
Kellogg’s Uniform ROA has actually been higher than its as-reported ROA in the past sixteen years, save for 2013. For example, Uniform ROA was at 16% in 2020 while as-reported ROA was less than half that at 7%.
Historically, Kellogg’s as-reported ROA has ranged from 6% to 13% in the past sixteen years while Uniform ROA has ranged from 9% to 19% in the same timeframe.
Historically, Kellogg has seen strong, but volatile profitability. After slowly falling from 18% in 2005 to 9% in 2013, Uniform ROA recovered to 15%-17% levels in 2014-2016 and subsequently dropped to 11% in 2017. Then, Uniform ROA improved to 19% in 2018, before dropping to 14%-16% through 2020.
Kellogg’s Uniform earnings margin is weaker than you think, but its Uniform asset turns make up for it

Uniform ROA expansion has been driven by trends in Uniform earnings margin, slightly offset by stable Uniform asset turns.
Uniform margins were sustained at 11%-13% levels from 2005-2012, before falling to 7% in 2013 and subsequently rebounding to 11% in 2014. Thereafter, Uniform margins faded to 8% in 2017, before recovering to 10% in 2020, excluding a brief jump to 12% in 2018.
Meanwhile, Uniform turns have maintained 1.4x-1.6x levels since 2005, excluding a 1.7x outperformance in 2018. Currently, Uniform turns sit at the high end of that range.
At current valuations, the market is pricing in expectations for both Uniform margins and Uniform turns to remain near current levels.
SUMMARY and Kellogg Company Tearsheet
As our Uniform Accounting tearsheet for Kellogg Company (K:USA) highlights, the Uniform P/E trades at 19.6x, which is below the global corporate average of 23.7x and its own historical P/E of 22.4x.
Low P/Es require low EPS growth to sustain them. In the case of Kellogg, the company has recently shown a 22% Uniform EPS growth.
Wall Street analysts provide stock and valuation recommendations that in general provide very poor guidance or insight. However, Wall Street analysts’ near-term earnings forecasts tend to have relevant information.
We take Wall Street forecasts for GAAP earnings and convert them to Uniform earnings forecasts. When we do this, Kellogg Wall Street analyst-driven forecast is a 17% and 1% EPS growth in 2021 and 2022, respectively.
Based on the current stock market valuations, we can use earnings growth valuation metrics to back into the required growth rate to justify Kellogg’s $63 stock price. These are often referred to as market embedded expectations.
The company is currently being valued as if Uniform earnings were to grow by 1% annually over the next three years. What Wall Street analysts expect for Kellogg’s earnings growth is above what the current stock market valuation requires in 2021, but in line with the requirement by 2022.
Furthermore, the company’s earning power is 3x the long-run corporate average. However, cash flows and cash on hand are slightly below its total obligations through 2025—including debt maturities, capex maintenance, and dividends. Together, this signals moderate credit and dividend risk.
That said, Kellogg’s Uniform earnings growth is above its peer averages. However, the company is trading below peer valuations.
About the Philippine Markets Daily
“Thursday Uniform Earnings Tearsheets – Global Focus”
Some of the world’s greatest investors learned from the Father of Value Investing or have learned to follow his investment philosophy very closely. That pioneer of value investing is Professor Benjamin Graham. His followers:
Warren Buffett and Charles Munger of Berkshire Hathaway; Shelby C. Davis of Davis Funds; Marty Whitman of Third Avenue Value Fund; Jean-Marie Eveillard of First Eagle; Mitch Julis of Canyon Capital; just to name a few.
Each of these great investors studied security analysis and valuation, applying this methodology to manage their multi-billion dollar portfolios. They did this without relying on as-reported numbers.
Uniform Adjusted Financial Reporting Standards (UAFRS or Uniform Accounting) is an answer to the many inconsistencies present in GAAP and IFRS, as well as in PFRS.
Under UAFRS, each company’s financial statements are rebuilt under a consistent set of rules, resulting in an apples-to-apples comparison. Resulting UAFRS-based earnings, assets, debts, cash flows from operations, investing, and financing, and other key elements become the basis for more reliable financial statement analysis.
Every Thursday, we focus on one multinational company that’s particularly interesting from a UAFRS vs as-reported standpoint. We highlight one adjustment that illustrates why the as-reported numbers are unreliable.
This way, we gain a better understanding of the factors driving a particular stock’s returns, and whether or not the firm’s true profitability is reflected in its current valuations.
Hope you’ve found this week’s Uniform earnings tearsheet on a multinational company interesting and insightful.
Stay tuned for next week’s multinational company highlight!
Regards,
Angelica Lim
Research Director
Philippine Markets Daily
Powered by Valens Research
www.valens-research.com


