
This jewelry company has managed to thrive for nearly two centuries by adapting to industry trends, with a Uniform ROA shining at 13%!

With the growth of the middle and upper classes, China’s local jewelry market continues to prosper and flourish.
This company is known for not only being one of the largest, but also as one of the veteran players in the retail jewelry brands in China, with more than 3,800 stores worldwide. Thanks to its ability to adapt to the industry trends, the company continues to thrive through the years.
Although the company has been operating for over 170 years, as-reported metrics are understating its profitability. Uniform metrics show the REAL Uniform return on assets (ROA) of the company.
Also below, Uniform Accounting Embedded Expectations Analysis and the Uniform Accounting Performance and Valuation Tearsheet for the company.
Philippine Markets Daily:
Wednesday Uniform Earnings Tearsheets – Asia-listed Focus
Powered by Valens Research
In China, an increasing trend in the importance of self-expression among the youth, as well as the steady growth of the middle and upper classes, has secured the Chinese jewelry market as an avenue of growth in the next few years.
According to MarketingtoChina, most of the revenue in the global jewelry segment is attributable to China, which had almost USD 18 billion sales in 2020. The market is also expected to grow by 4.2% annually until 2023.
China’s jewelry market is composed of mostly world-renowned Hong Kong brands and mainland Chinese brands that cater to medium and high-end markets, while foreign jewelry brands target the high-end diamond jewelry market and high net worth individuals.
About 35 jewelry companies listed in China recorded total revenues amounting to RMB 203.4 billion (approximately USD 29.2 billion) in 2019.
Among these brands, Chow Tai Fook held around 8.1% of the total market share while Chow Tai Seng had the largest number of stores of 4,011 outlets as of December 31, 2019.
In second place in terms of number of stores is Lao Feng Xiang with over 3,800 outlets. It also enjoys about 6.6% total market share in China, making the company one of the leading players in the Chinese jewelry industry.
Lao Feng Xiang’s success in its 172 years of operations is partly due to its ability to shift strategies to adapt to the trends in the jewelry industry.
For example, as a luxury brand, its main market is the wealthy Chinese consumers. These consumers reside in Tier 1 and Tier 2 cities. The city-tier classification system in China is based on the size and wealth of the city, with Tier 1 being the wealthiest and largest.
However, instead of limiting its market reach in those wealthy cities, Lao Feng Xiang decided to prioritize its expansion into Tier 3 and 4 cities. Although Tier 1 and 2 cities are better positioned economically, socially, and politically, the company recognized that with the rise of the middle class, opportunity exists in the lower-tier cities.
The company was rewarded for its efforts as evidenced by a significant increase in their revenues from RMB 14.3 billion in 2010 to RMB 49.6 billion in 2019, as they opened more stores in lower-tier cities.
Another factor behind Lao Feng Xiang’s longevity lies in its ability to incorporate science and technology with its traditional manual craftsmanship. In 2010, it introduced the use of 3D printing to make its jewelry production more efficient than before. Even with all the advancements in technology, the company was still able to preserve its traditional goldsmithing techniques gleaned from traditional arts dated back to Shang and Zhou dynasties.
After becoming an established national brand in China, the jewelry maker then focused on accelerating its expansion outside of the mainland, starting with Hong Kong.
In 2015, the jewelry company opened its first stores in Hong Kong. In the same year, the company also opened its first store in Canada. The company then started operating flagship stores in New York City and Sydney, Australia soon after.
By opening up these international boutiques, Lao Feng Xiang started its move to grow and transform from just a national brand to an international name.
In addition, Lao Feng Xiang employs precision marketing to be able to market and sell its products better. By collecting data from its customers, the company is able to understand its consumers’ preferences and use it in its designing, pricing, marketing, and channeling its products.
With the company’s adaptability to current industry trends and its international expansion, one would expect this company to be doing really well, especially since it has been operating for nearly two centuries now.
However, as-reported metrics show a company that is doing better than its cost of capital but that is nowhere near the profitability levels of a company that seems to have benefited from a surge in luxury goods demand. As-reported metrics are overlooking all of the company’s successful strategies, showing as-reported ROA at just 11%.
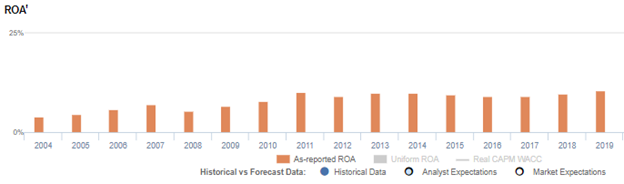
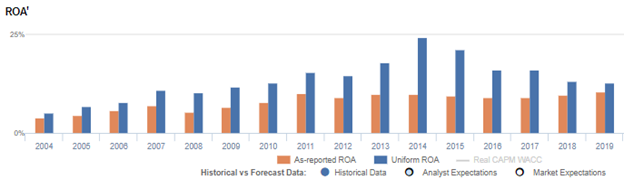
In reality, Lao Feng Xiang has benefited more from its strategies, with Uniform ROAs that are consistently more robust than what as-reported metrics show. Even though the company’s Uniform ROA has come down to 13%, it is still higher than its as-reported ROA of 11%.
What as-reported metrics fail to do is to consider the company’s excess cash on the balance sheet. While most companies inherently need some level of cash to operate, the portion of that balance that is earning limited or no return—or excess cash—ends up diluting as-reported ROAs.
When excess cash remains included in the company’s asset base in computing its performance metrics, the company’s profitability and capital efficiency may appear weaker than it actually is. Removing excess cash allows investors to see through the distortions that come from management carrying much more cash on the balance sheet than what is operationally required.
From 2014 to 2019, Lao Feng Xiang has had a significant amount of excess cash sitting idly in its balance sheet, ranging from 10% to 20% of its as-reported total assets.
After excess cash and other significant adjustments are made, we can see that the company’s Uniform ROAs are actually greater than the as-reported ROAs. This shows that the company is having much more success in its strategies than what the market thinks.
Lao Feng Xiang’s profitability is much better than you think it is

As-reported metrics are distorting the market’s perception of the firm’s profitability.
If you were to just look at as-reported ROA, you would think that the company is a weaker business than real economic metrics highlight.
Lao Feng Xiang’s Uniform ROA has been higher than its as-reported ROA in the past sixteen years. For example, when Uniform ROA peaked at 24% in 2014, as-reported ROA was only 10%.
The company’s Uniform ROA for the past eight years has ranged from 5% to 24%, while as-reported ROA remained only between 4% and 11% in the same time frame. From 5% in 2004, Uniform ROA gradually expanded to 24% in 2014 before declining to 13% in 2019.
Lao Feng Xiang’s Uniform earnings margins are weaker than you think but robust Uniform asset turns make up for it
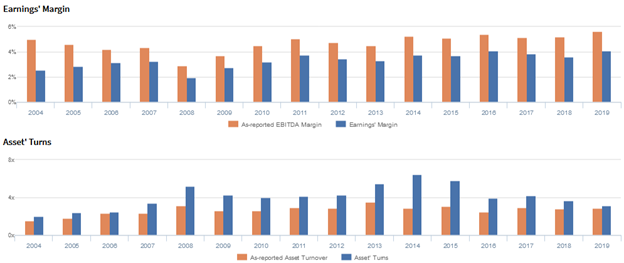
Volatility in Uniform ROA has been driven by trends in Uniform asset turns, and to a lesser extent by Uniform earnings margins, with peaks and troughs lining up historically with that of Uniform ROA.
From 3% levels in 2004-2007, Uniform margins decreased to 2% in 2008 before rising back to 3%-4% levels through 2019.
Meanwhile, Uniform turns rose from 2.0x in 2004 to 5.2x in 2018, before falling to 4.0x in 2010. It then reached a peak of 6.5x in 2014, before fading to 3.1x in 2019.
SUMMARY and Lao Feng Xiang Co., Ltd Limited Tearsheet
As the Uniform Accounting tearsheet for Lao Feng Xiang Co., Ltd (600612:CHN) highlights, its Uniform P/E trades at 11.5x, which is below corporate average valuation levels, but around its own recent history.
Low P/Es require low EPS growth to sustain them. In the case of Lao Feng Xiang, the company has recently shown a 31% Uniform EPS growth.
Sell-side analysts provide stock and valuation recommendations that in general provide very poor guidance or insight. However, sell-side analysts’ near-term earnings forecasts tend to have relevant information.
We take sell-side forecasts for Chinese Accounting Standards (CAS) earnings and convert them to Uniform earnings forecasts. When we do this, Lao Feng Xiang’s sell-side analyst-driven forecast is an 8% and 19% earnings growth in 2020 and 2021, respectively.
Based on the current stock market valuations, we can use earnings growth valuation metrics to back into the required growth rate to justify Lao Feng Xiang’s CNY 47 stock price. These are often referred to as market embedded expectations.
Lao Feng Xiang can have a 4% Uniform earnings shrinkage each year over the next three years and still justify current market expectations. What sell-side analysts expect for Lao Feng Xiang’s earnings is above what the current stock market valuation requires in 2020 and 2021.
The company’s earning power is twice the corporate average. Additionally, cash flows and cash on hand are 4.5x its total obligations. Together, this signals a low credit and dividend risk.
To conclude, Lao Feng Xiang’s Uniform earnings growth is above its peer averages in 2020. However, the company is trading well below its peer valuations.
About the Philippine Market Daily
“Wednesday Uniform Earnings Tearsheets – Asia-listed Focus”
Some of the world’s greatest investors learned from the Father of Value Investing or have learned to follow his investment philosophy very closely. That pioneer of value investing is Professor Benjamin Graham. His followers:
Warren Buffett and Charles Munger of Berkshire Hathaway; Shelby C. Davis of Davis Funds; Marty Whitman of Third Avenue Value Fund; Jean-Marie Eveillard of First Eagle; Mitch Julis of Canyon Capital; just to name a few.
Each of these great investors studied security analysis and valuation, applying this methodology to manage their multi-billion dollar portfolios. They did this without relying on as-reported numbers.
Uniform Adjusted Financial Reporting Standards (UAFRS or Uniform Accounting) is an answer to the many inconsistencies present in GAAP and IFRS, as well as in PFRS.
Under UAFRS, each company’s financial statements are rebuilt under a consistent set of rules, resulting in an apples-to-apples comparison. Resulting UAFRS-based earnings, assets, debts, cash flows from operations, investing, and financing, and other key elements become the basis for more reliable financial statement analysis.
Every Wednesday, we focus on one company listed in Asia that’s relevant to the Philippines and that’s particularly interesting from a UAFRS vs as-reported standpoint. We highlight one adjustment that illustrates why the as-reported numbers are unreliable.
This way, we gain a better understanding of the factors driving a particular stock’s returns, and whether or not the firm’s true profitability is reflected in its current valuations.
Hope you’ve found this week’s Uniform Earning Tearsheet on an Asian company interesting and insightful.
Stay tuned for next week’s Asia company highlight!
Regards,
Angelica Lim
Research Director
Philippine Markets Daily
Powered by Valens Research
www.valens-research.com


