
This publicly listed bank has gained a new international partner in its bid to claim a piece of the digital payment gateway pie…also, JFC tearsheet

While non-bank financial companies such as Paymongo and PayMaya Enterprise dominate digital payment gateways in the Philippines, banks like AUB have stepped up in enhancing their own digital platform. With two million users, how does the AUB PayMate platform compare in functionality?
We also take a look at one of the unit investment trust funds (UITF) offered by the bank. In addition to examining the fund’s portfolio, we are including a fundamental analysis of one of the fund’s largest holdings, providing you with the current Uniform Accounting Performance and Valuation Tearsheet for that company.
Philippine Markets Newsletter:
Friday Uniform Portfolio Analytics
Powered by Valens Research
Among the numerous Filipino banks competing to digitize services and increase accessibility, Asia United Bank (AUB), one of the country’s fastest-growing publicly listed universal banks, has been consistently growing its digital portfolio.
AUB has partnered with Wallyt, a leading global digital banking solution provider, to launch a card payment acceptance solution for merchants via a quick card QR code or link. Through this partnership, AUB PayMate merchants can accept Mastercard payments from customers without incurring additional costs for the payment terminal.
As AUB’s digital platform, AUB PayMate allows physical store and e-commerce merchants to accept digital payments from customers whether online or offline. From local or foreign e-wallets, bank payments, to cards, this one-stop-shop offers convenience, speed, and safety under the challenging health environment.
- Alipay
- Alipay+
- GCash
- Grab Pay
- HelloMoney
- Home Credit
- PayNow
- QR PH
- Shopee Pay
- Thai QR Payment
- UnionPay
- WeChat Pay
- XNAP
The digital payment service is part of AUB’s efforts to help more merchants, especially micro, small and medium enterprises (MSMEs), to digitize and accelerate operations via new innovations such as Mastercard payment acceptance.
According to the Bangko Sentral ng Pilipinas, digital payments had surged by 5,000% by Q2 2021 versus pre-pandemic levels. To facilitate these, digital payment gateways such as AUB PayMate have gained enormous traction. By the end of 2021, GCash Payment Solutions, PayMaya Enterprise, PayMongo, Dragonpay, and Coins.ph were the top players of digital payment gateways.
Although AUB PayMate has not found its place in this list yet, the gateway does have a unique selling point to merchants. Through AUB PayMate’s Alipay/WeChat Pay payment services, merchants can leverage a portion of the 1.7 million Chinese tourists/migrants in the Philippines, who made up 21% of foreign visitors in pre-pandemic 2019.
By Q3 2021, AUB digital services have reached two million users since its launch in late 2019 after the pandemic led to a surge in demand.
AUB’s new service aside, we take another look at one of the UITFs AUB offers—AUB Equity Investment Fund.
The AUB Equity Investment Fund was established on May 4, 2006, is an equity fund that invests in blue-chips and major second-line issues included in the Philippine Stock Exchange (PSEi). The fund aims to achieve a rate of return equivalent to the rolling 90-day yield of the PSEi, net of fees.
The fund is suitable for investors who have an aggressive risk appetite, willing to stay invested for at least three years, and who are willing to accept higher volatility of returns and even possible loss of principal.
The fund is currently invested in at least 86% of selected shares of blue-chip or second-line stocks while the remaining is in cash.
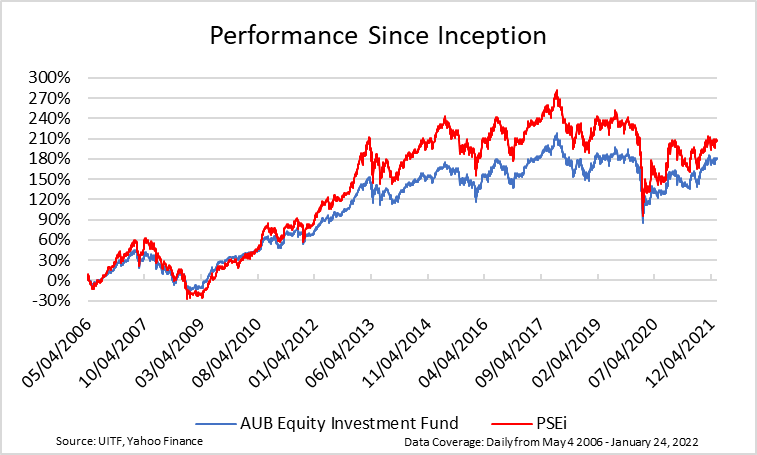
- At its inception in May 2006, the AUB Equity Investment Fund’s initial net asset value per unit (NAVPU) was at PHP 100.00. After rising to PHP 144.95 in July 2007, the fund fell to a historical low of PHP 79.93 in October 2008 in the midst of the global financial crisis. The fund recorded a loss of 45%, outperforming its benchmark, the PSEi, which incurred a loss of 55% over the same period. Meanwhile, the PSEi incurred an equal loss of 14% in the same period.
- The fund then recovered to its highest peak of PHP 317.94 in January 2018—an increase of 298%, but underperformed its benchmark’s gain of 429% over the same period.
- After reaching this peak, the fund dropped 22% to PHP 246.90 in November 2018 due to various concerns such as Brexit and the US-China trade war. Similarly, the PSEi had a loss of 24% in the same time span.
- By the end of 2019, the fund had rebounded by 19% to a NAVPU of PHP 294.03, before it fell to a low of PHP 184.53 in March 2020 due to the coronavirus-induced market selloff. The fund’s 37% loss outperformed its benchmark’s 43% loss during this period.
- As of January 24, 2021, the fund recovered to a NAVPU of PHP 280.67, a 52% gain from its 2020 low, but still underperformed compared to the PSEi’s gain of 58%.
- Since its inception, AUB Equity Investment Fund has had a cumulative 181% gain versus its benchmark’s cumulative 207% gain.
Even though the fund’s performance hasn’t been better than the market’s, it does not mean the companies in its holdings are of lower quality. As-reported metrics would have investors believe that the fund’s portfolio consists of companies that do not generate economic profit. Uniform Accounting reveals the truth behind the companies this fund invests in.
The table below shows the top nine core non-financial holdings of the AUB Equity Investment Fund along with its Uniform return on assets (ROA), as-reported ROA, and ROA distortion—the difference between Uniform and as-reported ROA.
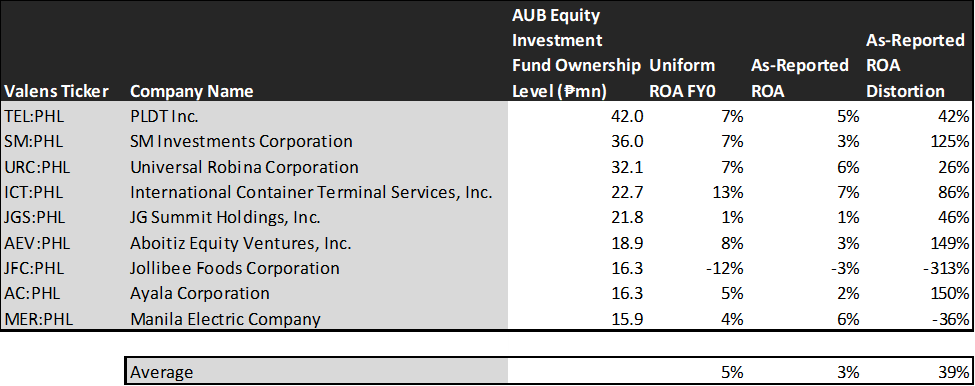
Most of the companies in the AUB Equity Investment Fund show as-reported ROAs at or below cost-of-capital levels, suggesting that they are not generating economic profit. Moreover, the fund is generating an average as-reported ROA of only 3%, 2x lower than the global corporate average returns of 6%.
However, on a Uniform Accounting basis, this UITF’s holdings have actually delivered better profitability with an average Uniform ROA of 5%, nearly 2x the average as-reported ROA.
The Uniform Accounting framework addresses financial statement inconsistencies attributable to the flaws present in the Philippine Financial Reporting Standards (PFRS). This enables investors to determine the true underlying performance of companies and avoid distorted financial analysis and valuation.
As such, it should not be surprising that when analyzing the non-financial holdings of the AUB Equity Investment Fund, the figures that easily stand out are the large discrepancies between Uniform ROA and as-reported ROA for these companies.
While at a glance, the difference between as-reported ROA and Uniform ROA may not seem that great, the distortion in percentage ranges from -313% to 150%, with Ayala Corporation (AC:PHL), Aboitiz Equity Ventures, Inc. (AEV:PHL), and SM Investments Corporation (SM:PHL) having the highest positive distortions.
Of these holdings, Jollibee Foods Corporation (JFC:PHL) and Manila Electric Company (MER:PHL) were revealed to have a lower Uniform ROA, presenting a potential cause for concern. Companies such as these need to be closely monitored for drastic changes that could negatively affect the fund itself, especially when the support behind the stocks’ performance begins to wane.
As-reported metrics understate the profitability of Ayala Corporation, suggesting an unprofitable firm with an as-reported ROA of 2%. In reality, this firm more closely resembles one that is breaking even, with a Uniform ROA of 5% in line with the average cost of capital. Prior to the pandemic, it consistently generated returns of at least 9% from 2005 to 2019.
Similarly, as-reported metrics understate the profitability of Aboitiz Equity Ventures, suggesting a firm with a below-average as-reported ROA of only 3%, when this is actually an above-average firm with an 8% Uniform ROA. It has consistently generated returns of at least 10% from 2010 to 2019.
Likewise, as-reported metrics understate the profitability of SM Investments Corporation, suggesting a below-average firm with an as-reported ROA of 3%. In fact, its Uniform ROA boasts a decent firm at 7%. Furthermore, it has consistently generated returns of at least 10% from 2005 to 2019.
By focusing on as-reported metrics alone, these companies look like anything but profitable businesses.
That said, looking at profitability alone is insufficient to deliver superior investment returns. Investors should also identify if the market is significantly undervaluing a company’s earnings growth potential.
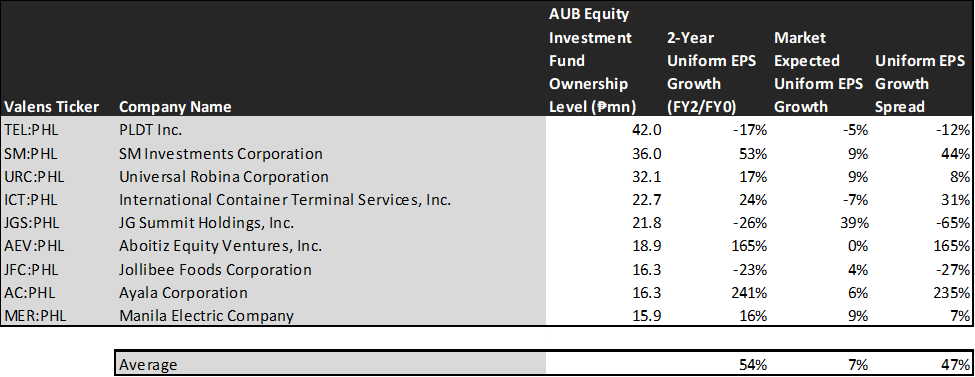
This table shows the earnings growth expectations for the major non-financial holdings of the fund. It features three key data points:
- The two-year Uniform earnings per share (EPS) growth represents the Uniform earnings growth the company is likely to have for the next two years. The earnings number used is the value of when we convert consensus sell-side analyst estimates according to the Uniform Accounting framework.
- The market expected Uniform EPS growth represents what the market thinks Uniform earnings growth is going to be for the next two years. Here, we show by how much the company needs to grow Uniform earnings in the next two years to justify the current stock price of the company. This is the market’s embedded expectations for Uniform earnings growth.
- The Uniform EPS growth spread is the difference between the two-year Uniform EPS growth and market expected Uniform EPS growth.
On average, Philippine companies are expected to have 5%-6% annual Uniform earnings growth over the next two years. Meanwhile, AUB Equity Investment Fund’s major holdings are forecasted to significantly outperform with a 54% projected Uniform earnings growth in the next two years, while the market is forecasting a similar performance with a 7% projected Uniform earnings growth.
All the companies in the AUB Equity Investment Fund have positive Uniform earnings growth except for PLDT Inc. (TEL:PHL), JG Summit Holdings, Inc. (JGS:PHL), and Jollibee Foods Corporation. Among these companies, Ayala Corporation, Aboitiz Equity Ventures, Inc., and SM Investments Corporation have the highest positive Uniform earnings growth spread.
The market is pricing Ayala Corporation’s Uniform Earnings to grow by only 6% in the next two years, while sell-side analysts are projecting the company’s earnings to grow by 241%.
Likewise, the market is pricing Aboitiz Equity Ventures’ Uniform earnings to grow immaterially in the next two years, while sell-side analysts are projecting the company’s earnings to grow by 165%.
Additionally, the market is pricing SM Investment Corporation’s Uniform earnings to grow by 9% in the next two years, while sell-side analysts are projecting the company’s earnings to grow by 53%.
Overall, as-reported numbers would significantly understate the expected earnings of these companies as shown by the Uniform-adjusted sell-side estimates.
While these firms suffer from the adverse effects of the coronavirus pandemic, dragging down their short-term earnings growth expectations, Uniform Accounting metrics show that these mature, low growth, but high return companies have intact business models that should drive economic profitability moving forward.
SUMMARY and Jollibee Foods Corporation Tearsheet
Today, we’re highlighting one of the individual stock holdings in the AUB Equity Investment Fund, Jollibee Foods Corporation (JFC:PHL).
As the Uniform Accounting tearsheet for Jollibee highlights, the company trades at a Uniform P/E of 31.1x, above both the global corporate average of 24.0x and its historical average of 25.6x.
High P/Es require high EPS growth to sustain them. In the case of Jollibee, the company has shown a 748% Uniform EPS shrinkage in 2020.
Sell-side analysts provide stock and valuation recommendations that poorly track reality. However, sell-side analysts have a strong grasp of near-term financial forecasts like revenue and earnings.
We take sell-side forecasts for Philippine Financial Reporting Standards (PFRS) earnings as a starting point for our Uniform earnings forecasts. When we do this, Jollibee’s sell-side analyst-driven forecast shows that Uniform earnings are expected to shrink by 135% in 2021 and grow by 69% in 2022.
Based on the current stock market valuations, we can back into the required earnings growth rate that would justify Jollibee’s PHP 243.80 stock price. These are often referred to as market embedded expectations.
The company has an earning power significantly below long-run corporate averages, but its cash flows and cash on hand consistently exceed obligations within five years. Jollibee has no risk to their dividend. Overall, Jollibee is seeing below-average earnings growth, and this is expected to continue.
Lastly, Jollibee’ Uniform earnings growth is well below peer averages but is trading above peer average valuations.
About the Philippine Markets Newsletter
“Friday Uniform Portfolio Analytics”
Investors who don’t engage in the buying or selling of securities for a living often rely on professionals to manage their own investments within the scope of their investment policies.
With so many funds and managers out there, it can get confusing and difficult to decide which one best suits your needs as an investor.
Every Friday at the end of the month, we focus on one fund in the Philippines and take a deeper look into their current holdings. Using Uniform Accounting, we identify the high-quality stocks in their portfolio which may not be obvious using the as-reported numbers.
We also identify which holdings may be problematic for the fund’s returns that they would need to reconsider from a UAFRS perspective.
To wrap up the fund analysis, we highlight one of their largest holdings and focus on key metrics to watch out for, accessible in our tearsheets.
Hope you’ve found this month’s focus on the AUB Equity Investment Fund interesting and insightful.
Stay tuned for next month’s Friday Uniform Portfolio Analytics!
Regards,
Angelica Lim
Research Director
Philippine Markets Newsletter
Powered by Valens Research
www.valens-research.com


